Fig. 9
Download original image
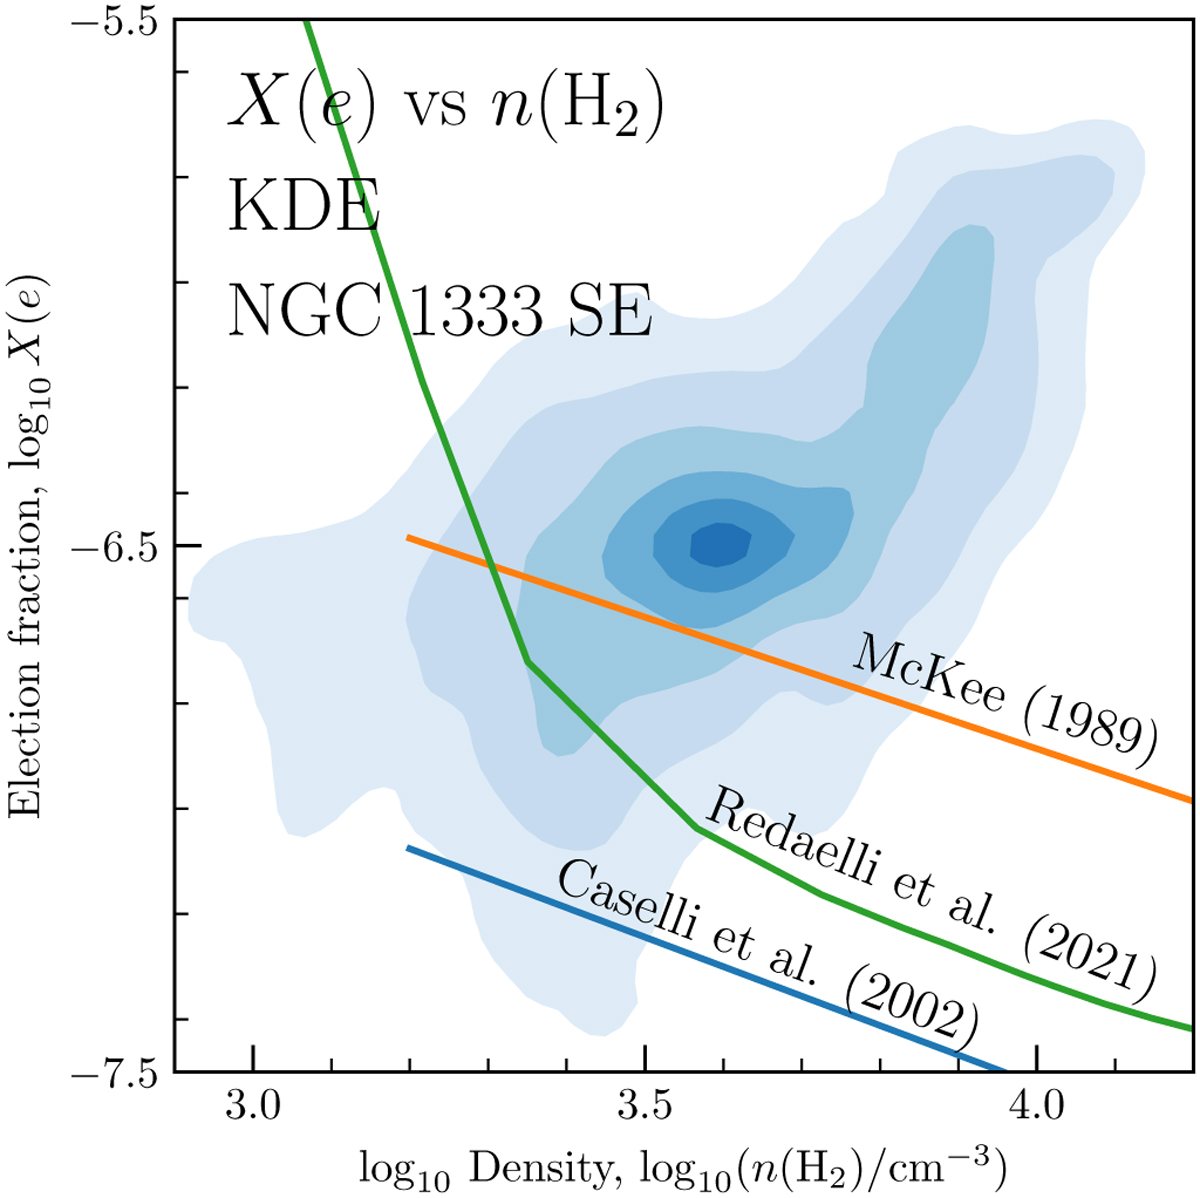
Electron fraction, X(e), as a function of H2 density. The KDE of the underlying distribution was obtained from the data. The contour levels are drawn starting at 0.5σ and progressing outward in steps of 0.5σ where the σ levels are equivalent to that of a bivariate normal distribution. The analytic relations from McKee (1989) and Caselli et al. (2002b) as well as the result from chemical modeling of L1544 (Redaelli et al. 2021) are shown with orange, blue, and green curves, respectively. The analytic relations shown here do not take into account the local generation of cosmic rays.
Current usage metrics show cumulative count of Article Views (full-text article views including HTML views, PDF and ePub downloads, according to the available data) and Abstracts Views on Vision4Press platform.
Data correspond to usage on the plateform after 2015. The current usage metrics is available 48-96 hours after online publication and is updated daily on week days.
Initial download of the metrics may take a while.