Fig. 7
Download original image
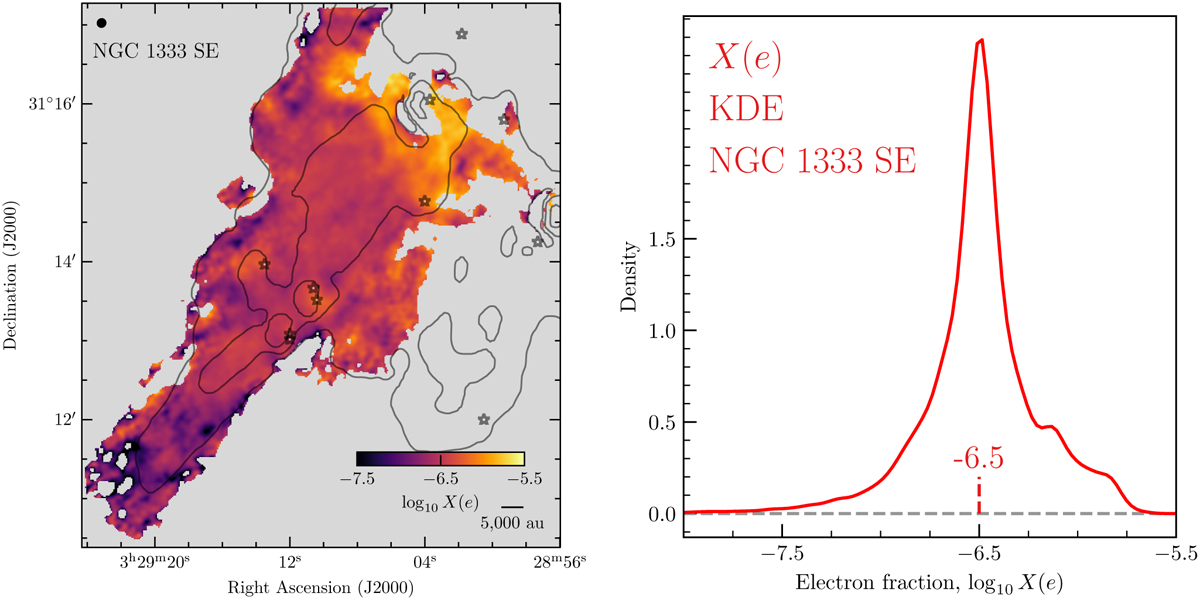
Derived electron fraction in the region. Left: map of the electron fraction, X(e). The map shows a smooth distribution but with a clear enhancement in the northwest section. The beam size and scale bar are shown in the top left and bottom right, respectively. The contours correspond to the Herschel-based H2 column map; the contours are the same as in Fig. 2. Right: Kernel density estimate of the X(e) distribution across the mapped region. A typical value (median of the log10) of 10−6.5 was derived from these measurements and is marked with a red dashed vertical line.
Current usage metrics show cumulative count of Article Views (full-text article views including HTML views, PDF and ePub downloads, according to the available data) and Abstracts Views on Vision4Press platform.
Data correspond to usage on the plateform after 2015. The current usage metrics is available 48-96 hours after online publication and is updated daily on week days.
Initial download of the metrics may take a while.