Open Access
Fig. 4
Download original image
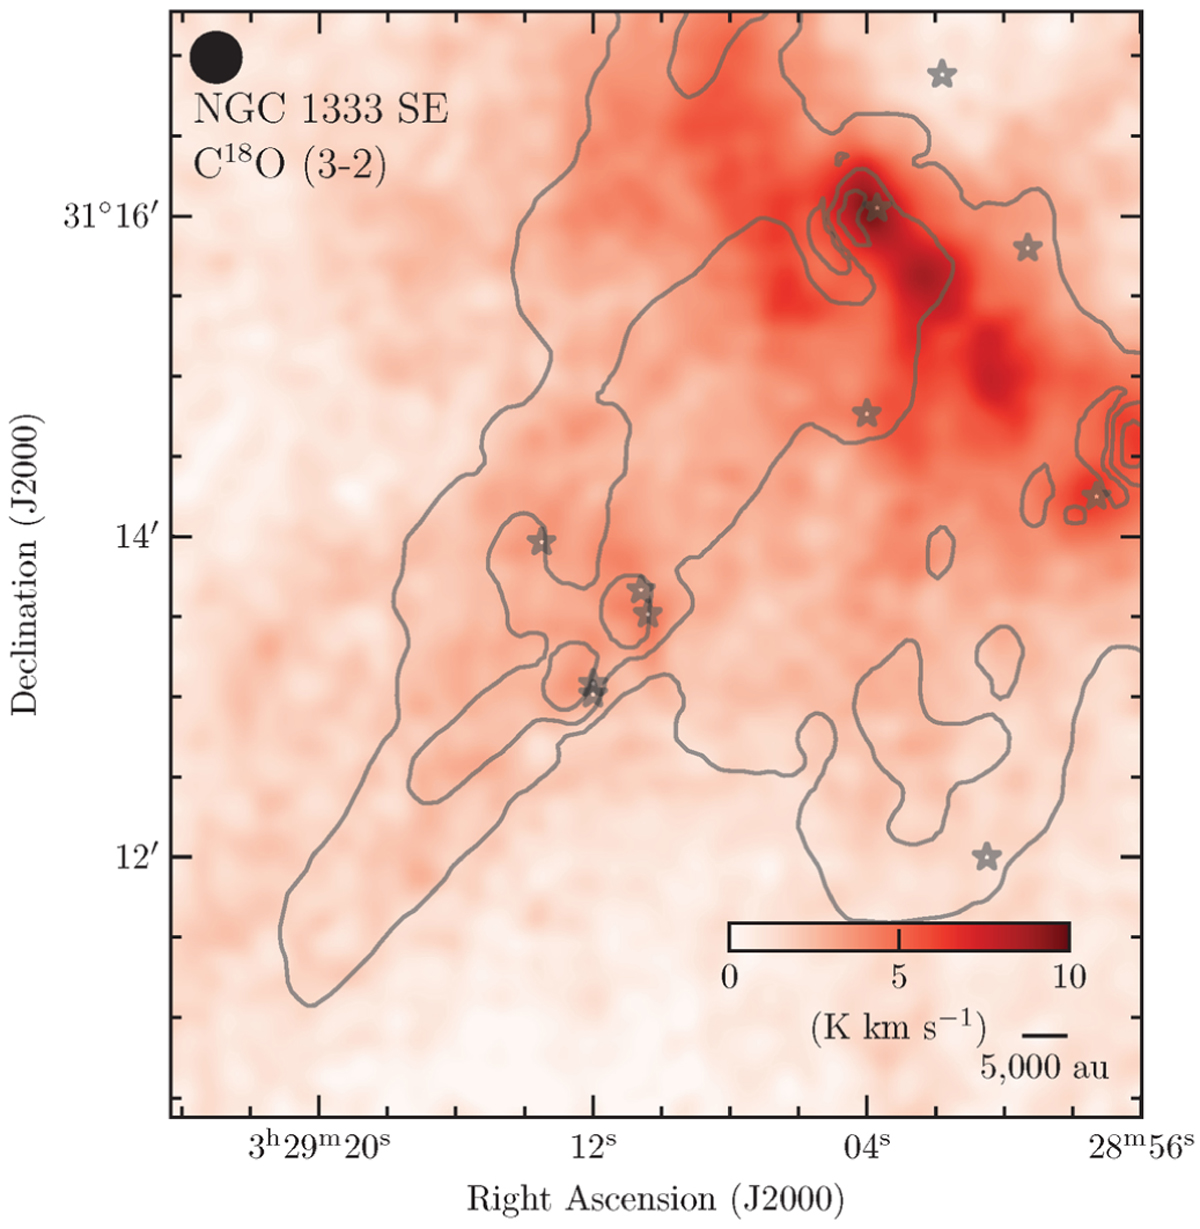
Integrated intensity map of the C18O (3−2) transition line. The contours correspond to the Herschel-based H2 column map, with the same contours as in Fig. 2. The beam size and scale bar are shown in top left and bottom right, respectively.
Current usage metrics show cumulative count of Article Views (full-text article views including HTML views, PDF and ePub downloads, according to the available data) and Abstracts Views on Vision4Press platform.
Data correspond to usage on the plateform after 2015. The current usage metrics is available 48-96 hours after online publication and is updated daily on week days.
Initial download of the metrics may take a while.