Fig. 2
Download original image
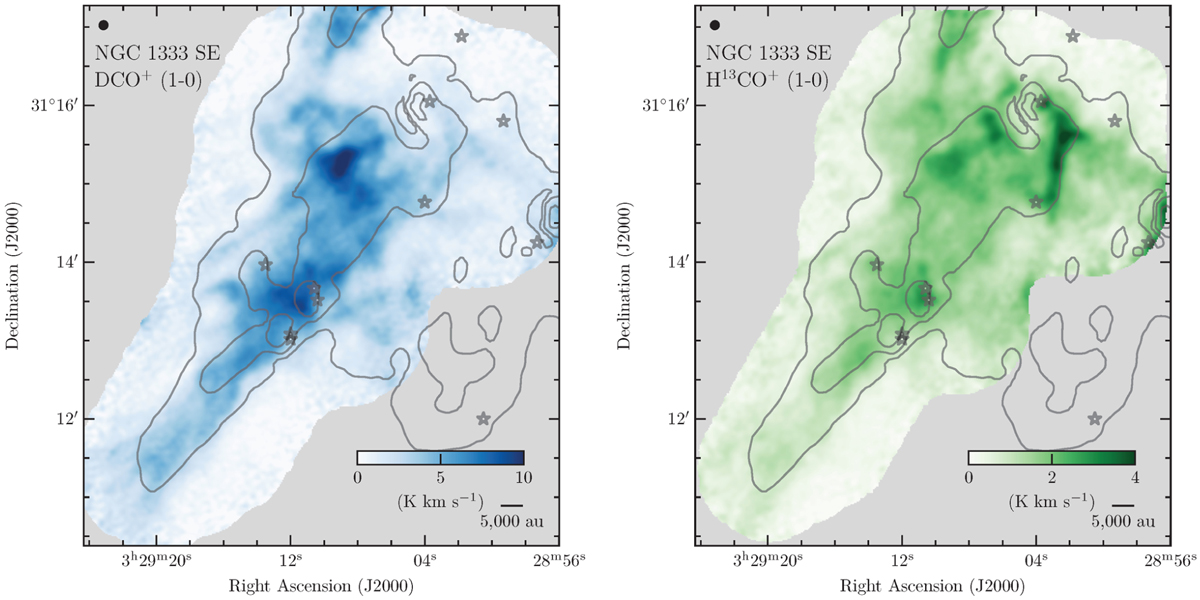
Maps of the DCO+ and H13CO+ (1−0) emission obtained with NOEMA and 30 m telescopes. The beam size and scale bar are shown in the top left and bottom right, respectively. The contours correspond to the Herschel-based H2 column map; the first level is at log10(N(H2)) = 22.2, and the step between levels is 0.5 dex. The stars mark the positions of the YSOs identified by Dunham et al. (2015) using Spitɀer observations.
Current usage metrics show cumulative count of Article Views (full-text article views including HTML views, PDF and ePub downloads, according to the available data) and Abstracts Views on Vision4Press platform.
Data correspond to usage on the plateform after 2015. The current usage metrics is available 48-96 hours after online publication and is updated daily on week days.
Initial download of the metrics may take a while.