Fig. C.1
Download original image
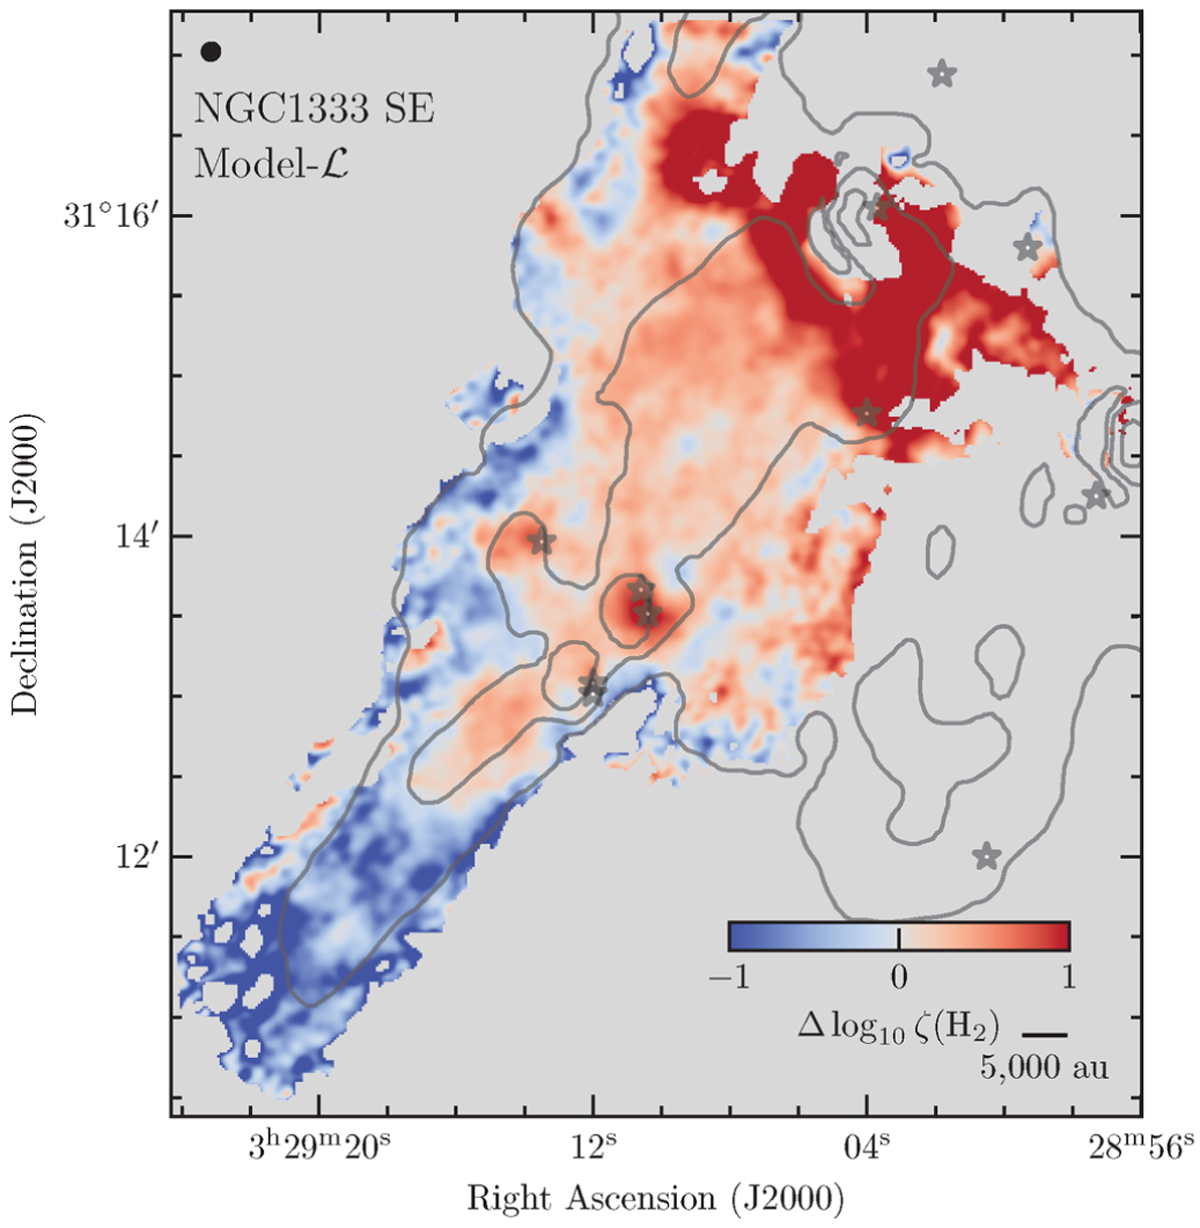
Difference between observed CRIR and the model-ℒ to better illustrate the local effects, ∆ log10 ζ = log10 ζobs − log10 ζmodel The red and blue colors show the excess and deficiency of CRIR with respect to the expected value following Padovani et al. (2018). The contours correspond to the Herschel-based H2 column map; the contours are the same as in Fig. 2. The beam size and scale bar are shown in the top-let and bottom-right corners, respectively.
Current usage metrics show cumulative count of Article Views (full-text article views including HTML views, PDF and ePub downloads, according to the available data) and Abstracts Views on Vision4Press platform.
Data correspond to usage on the plateform after 2015. The current usage metrics is available 48-96 hours after online publication and is updated daily on week days.
Initial download of the metrics may take a while.