Fig. 10
Download original image
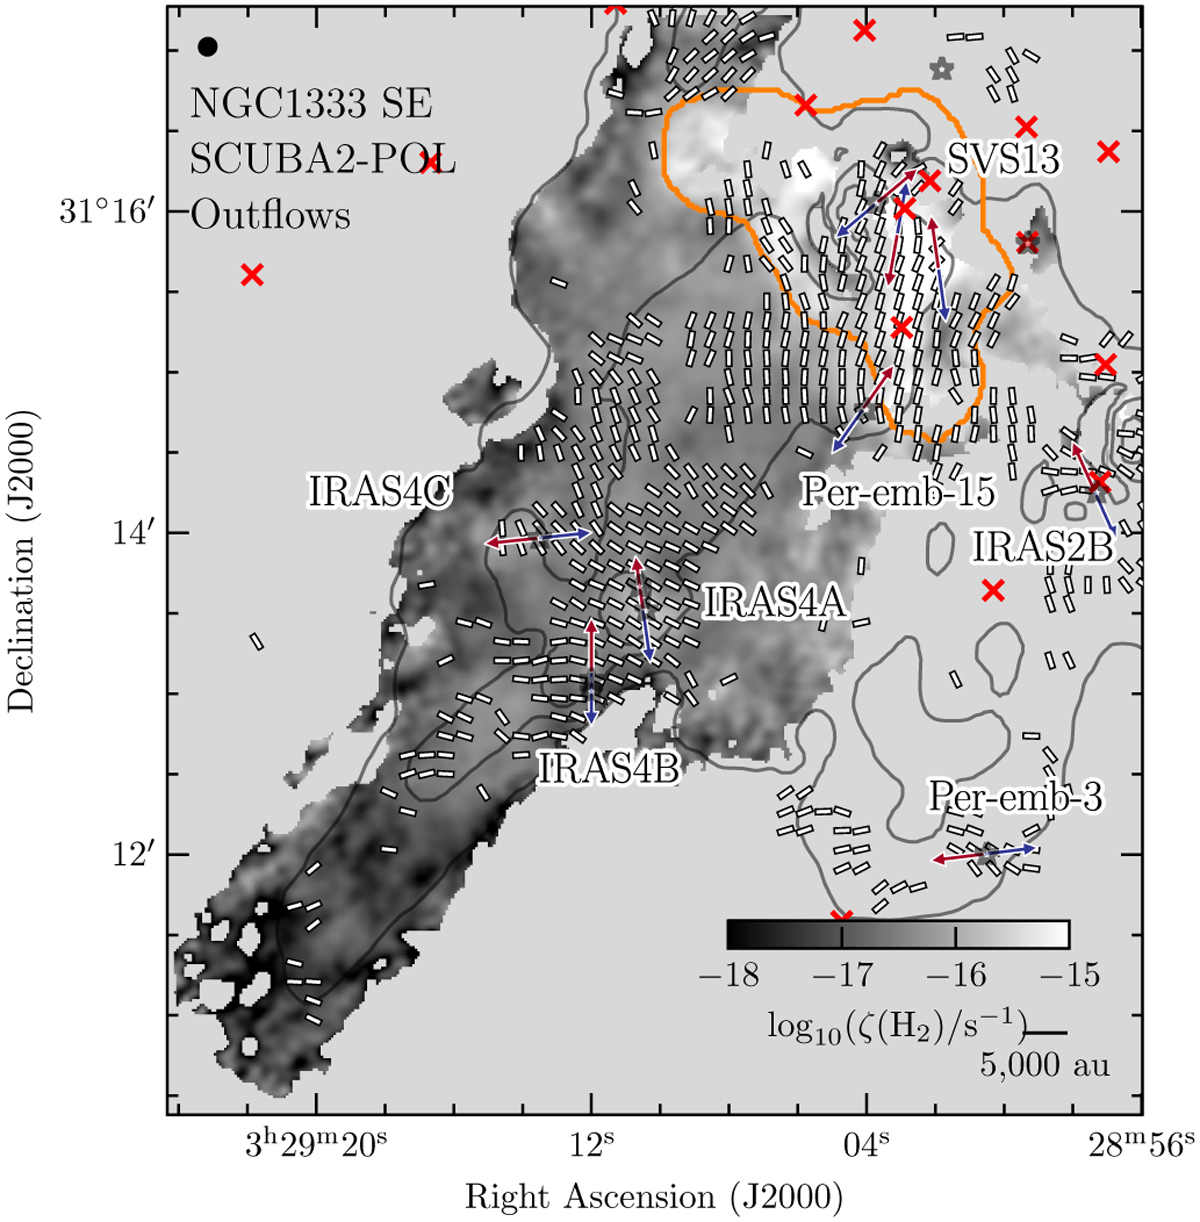
Outflows and magnetic field orientation over ζ(H2). The background image is the derived ζ(H2) map, as shown in Fig. 8. The region identified with a local cosmic-ray ionization rate enhancement is marked with an orange contour. The outflow lobes (as reported in previous works) are shown by red and blue arrows. The magnetic field orientation, measured from continuum polarization observations with SCUBA2-POL, are shown by the segments of white lines. The X-ray sources are marked with red crosses. The beam size and scale bar are shown in the top-let and bottom-right corners, respectively.
Current usage metrics show cumulative count of Article Views (full-text article views including HTML views, PDF and ePub downloads, according to the available data) and Abstracts Views on Vision4Press platform.
Data correspond to usage on the plateform after 2015. The current usage metrics is available 48-96 hours after online publication and is updated daily on week days.
Initial download of the metrics may take a while.