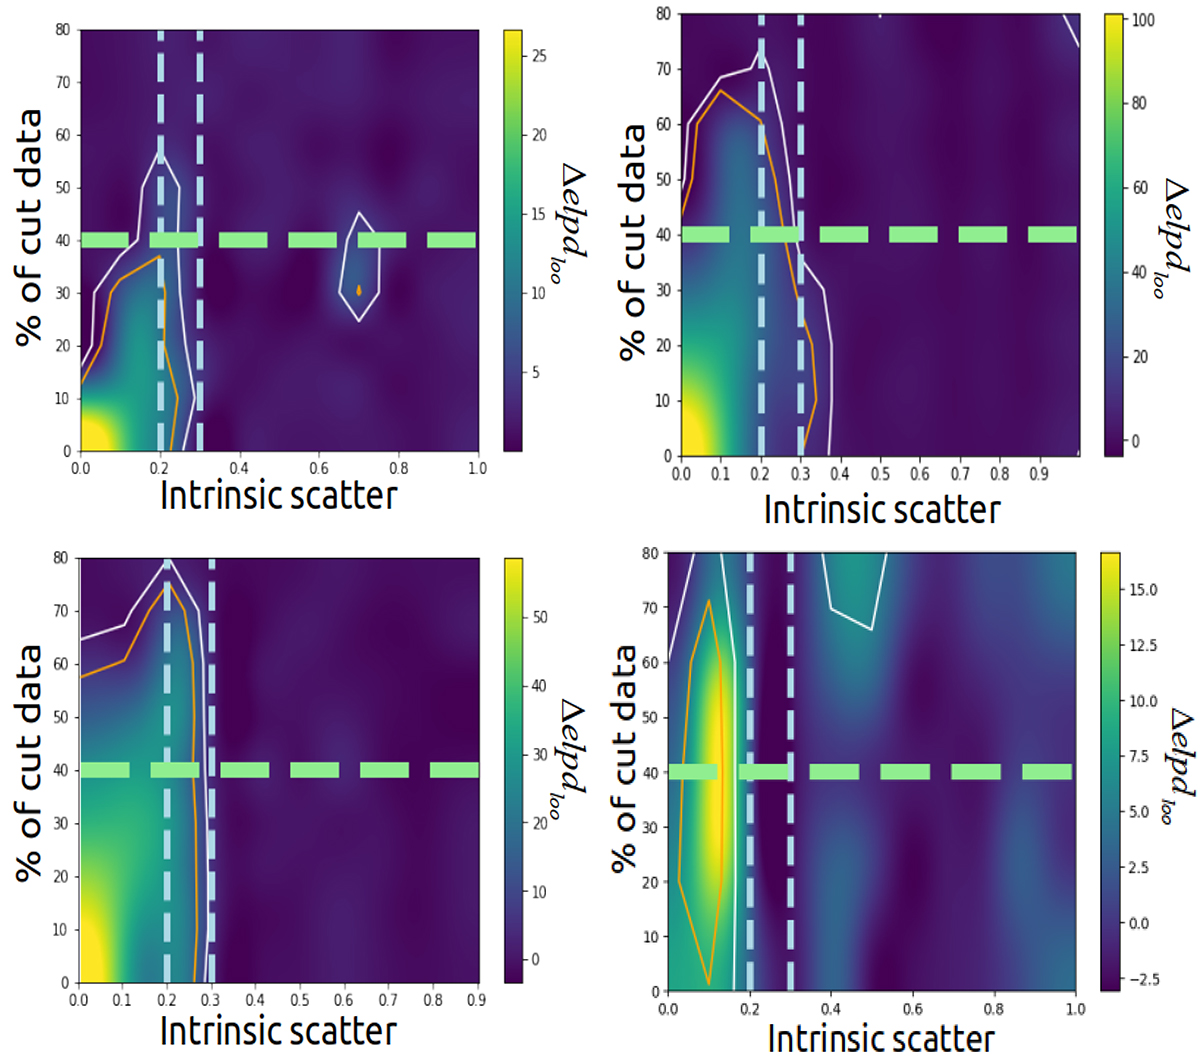
Fig. A.2.
Download original image
Plots of Δelpdloo of two models (broken and power law) as a function of both scatter (x-axis) and threshold set (y-axis) in terms of percentage of excluded data. Different figures represent different cases of break point assumption; from the upper left to bottom right panel xc = 2, 4, 6, 8. The orange and white contours trace a Δelpdloo of ten and four, respectively. The horizontal dashed line is placed at 40%, while the two vertical lines are at one scatter of 0.20 and 0.30.
Current usage metrics show cumulative count of Article Views (full-text article views including HTML views, PDF and ePub downloads, according to the available data) and Abstracts Views on Vision4Press platform.
Data correspond to usage on the plateform after 2015. The current usage metrics is available 48-96 hours after online publication and is updated daily on week days.
Initial download of the metrics may take a while.