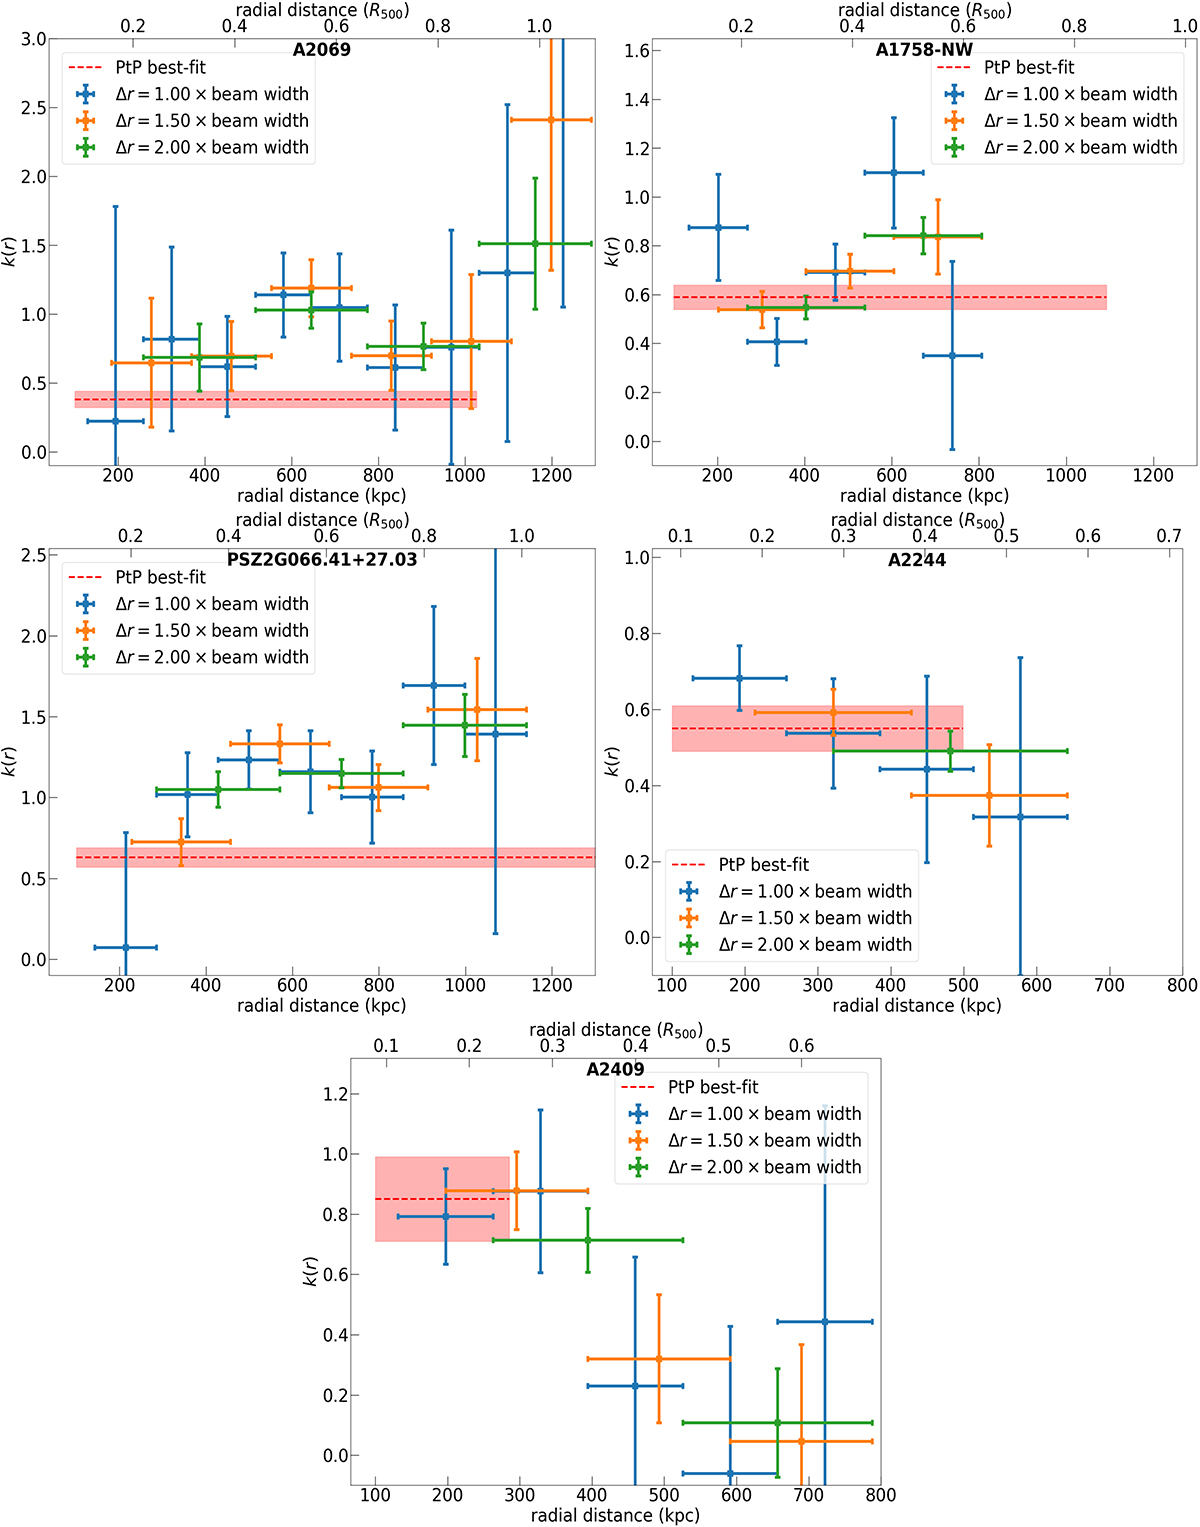
Fig. 4.

Download original image
IR − IX slope as a function of the radius (i.e. distance from the halo centre) for the five presented targets. The k values are computed using Eq. (6) among the consequent annuli. To reduce possible dependencies on the annulus width, we report the results for three different sizes of the annuli (1, 1.5, 2 × beam size). The red dotted horizontal line indicates the best-fit slope found by the point-to-point analysis (with its error) up to the radius considered for that analysis.
Current usage metrics show cumulative count of Article Views (full-text article views including HTML views, PDF and ePub downloads, according to the available data) and Abstracts Views on Vision4Press platform.
Data correspond to usage on the plateform after 2015. The current usage metrics is available 48-96 hours after online publication and is updated daily on week days.
Initial download of the metrics may take a while.


