Fig. 3.
Download original image
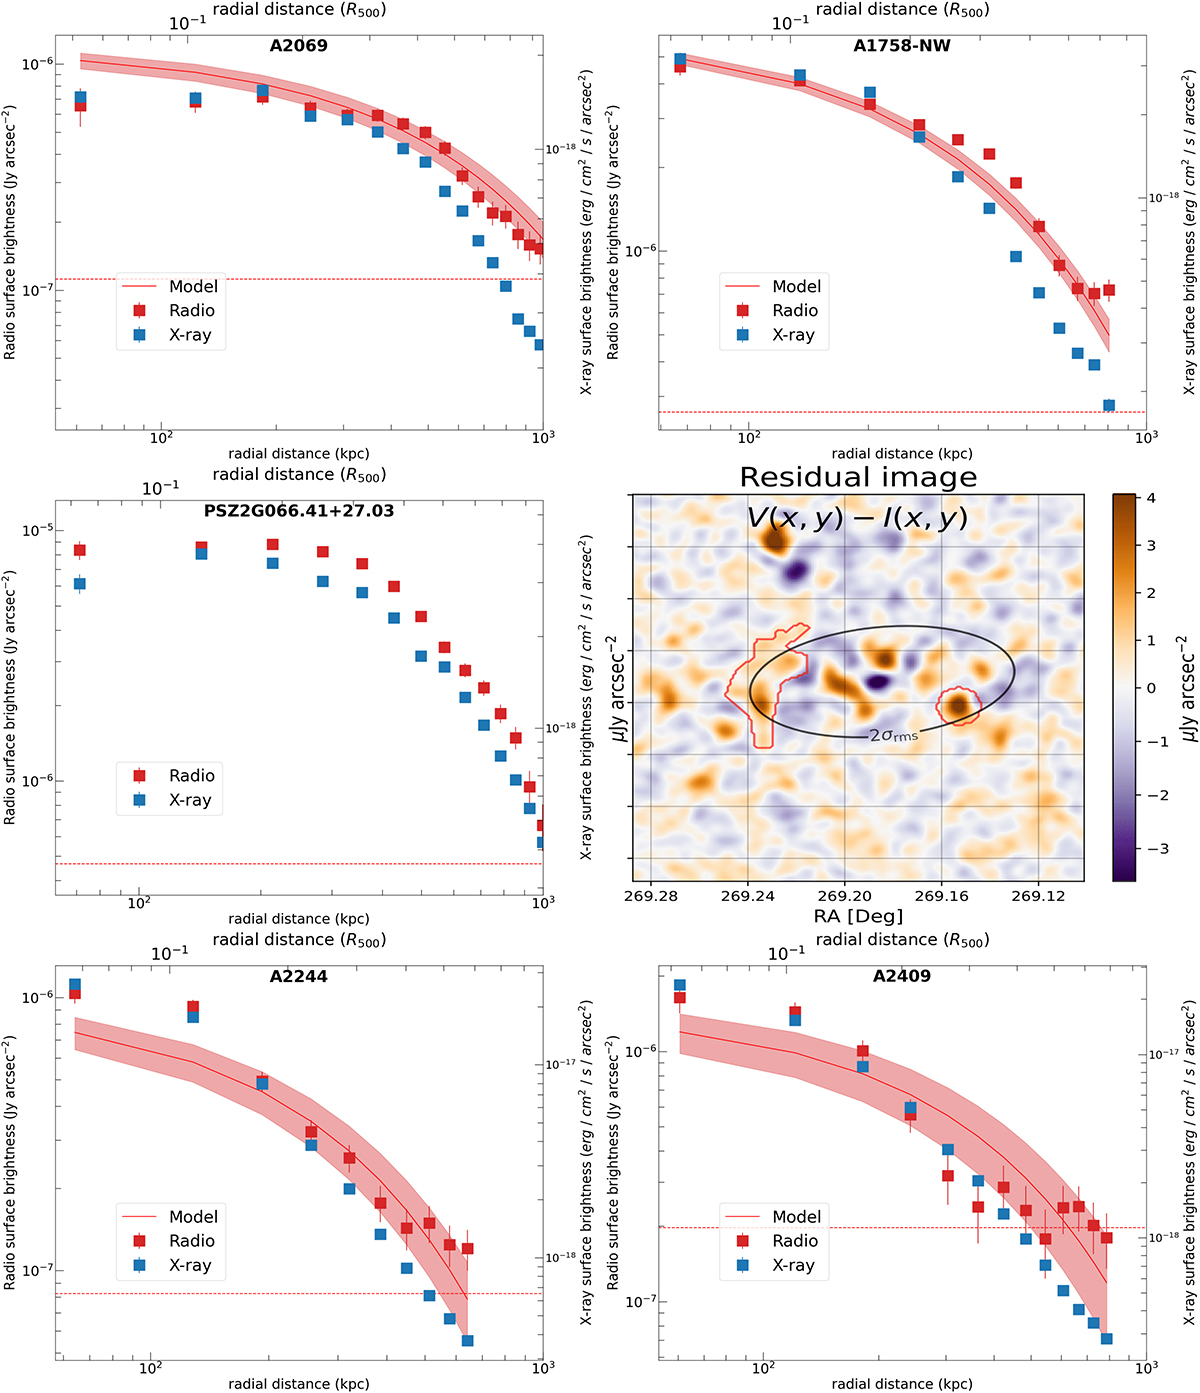
Radial profiles for five studied objects (in the cases of elliptical annuli, we consider the major axis for the radial distance). The radio emission with the best-fit model found from Halo-FDCA and errors (shaded) is shown in red; the X-ray emission extracted in the same regions is shown in blue. The red dotted line is the 1σ threshold of the radio images. For PSZ2G066.41+27, we report the 1D profile and the residual image after the subtraction of the elliptical exponential model, with the masked regions in red.
Current usage metrics show cumulative count of Article Views (full-text article views including HTML views, PDF and ePub downloads, according to the available data) and Abstracts Views on Vision4Press platform.
Data correspond to usage on the plateform after 2015. The current usage metrics is available 48-96 hours after online publication and is updated daily on week days.
Initial download of the metrics may take a while.