Open Access
Fig. C.1.
Download original image
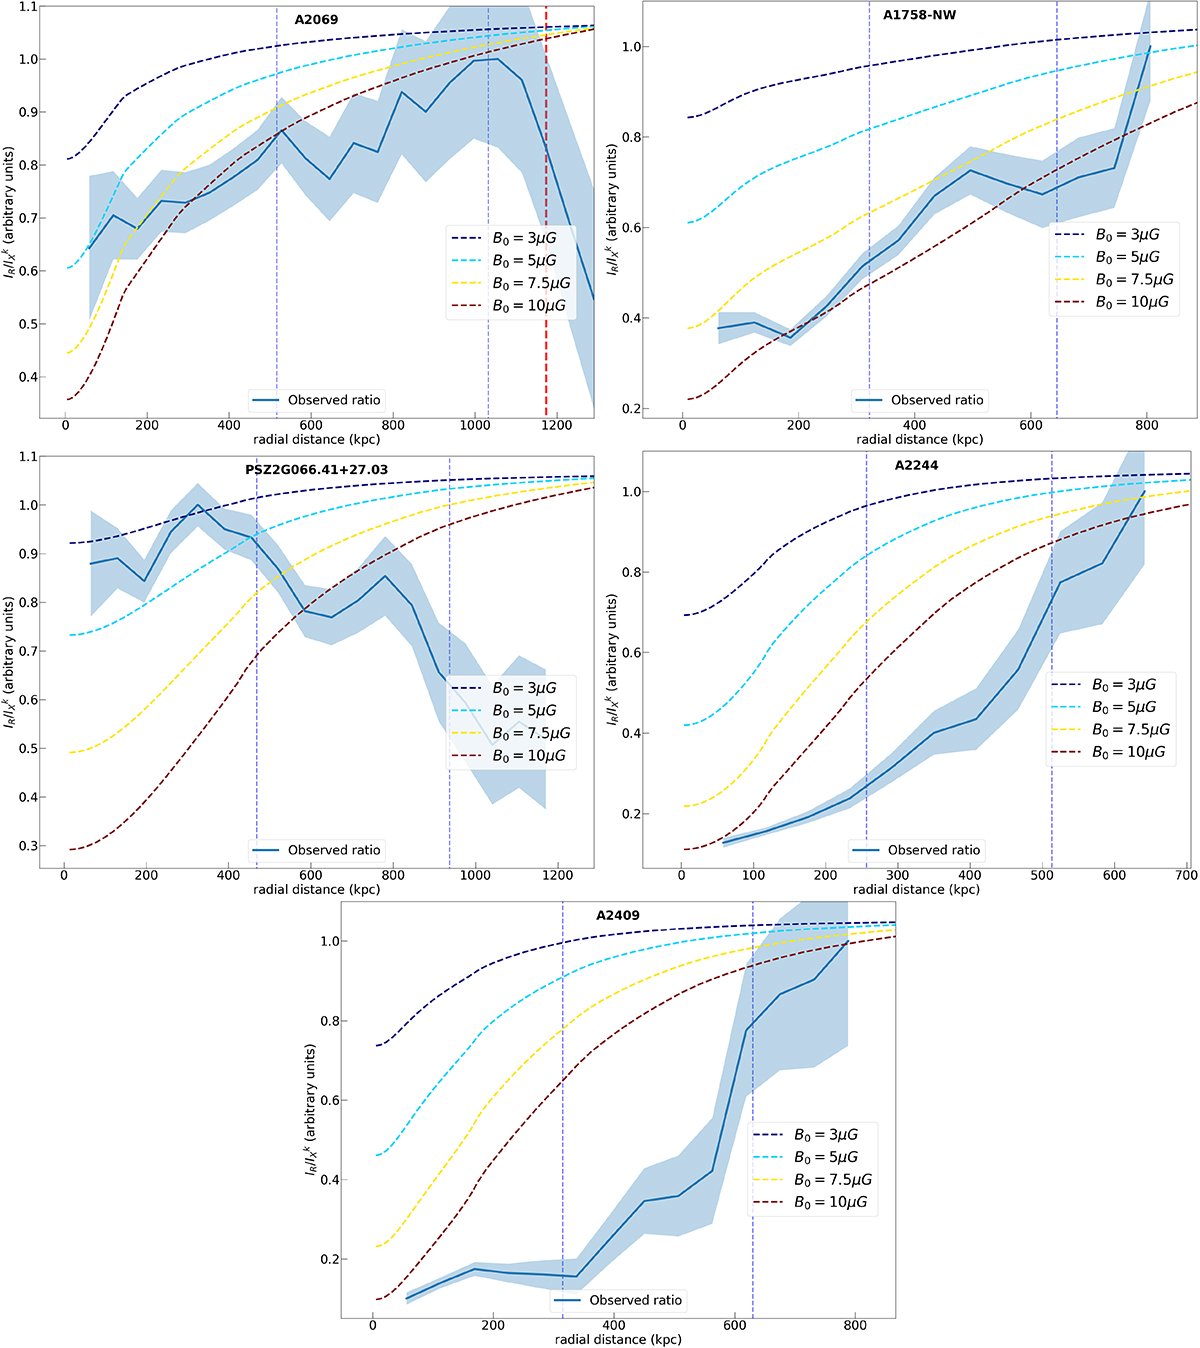
IR/IX ratio as function of radius (i.e. distance from the halo centre) for five presented targets. For A2069, the red dotted vertical line defines the radius beyond which the average signal in the annulus falls below 1σRMS. The thinner blue lines are at Re and 2Re.
Current usage metrics show cumulative count of Article Views (full-text article views including HTML views, PDF and ePub downloads, according to the available data) and Abstracts Views on Vision4Press platform.
Data correspond to usage on the plateform after 2015. The current usage metrics is available 48-96 hours after online publication and is updated daily on week days.
Initial download of the metrics may take a while.