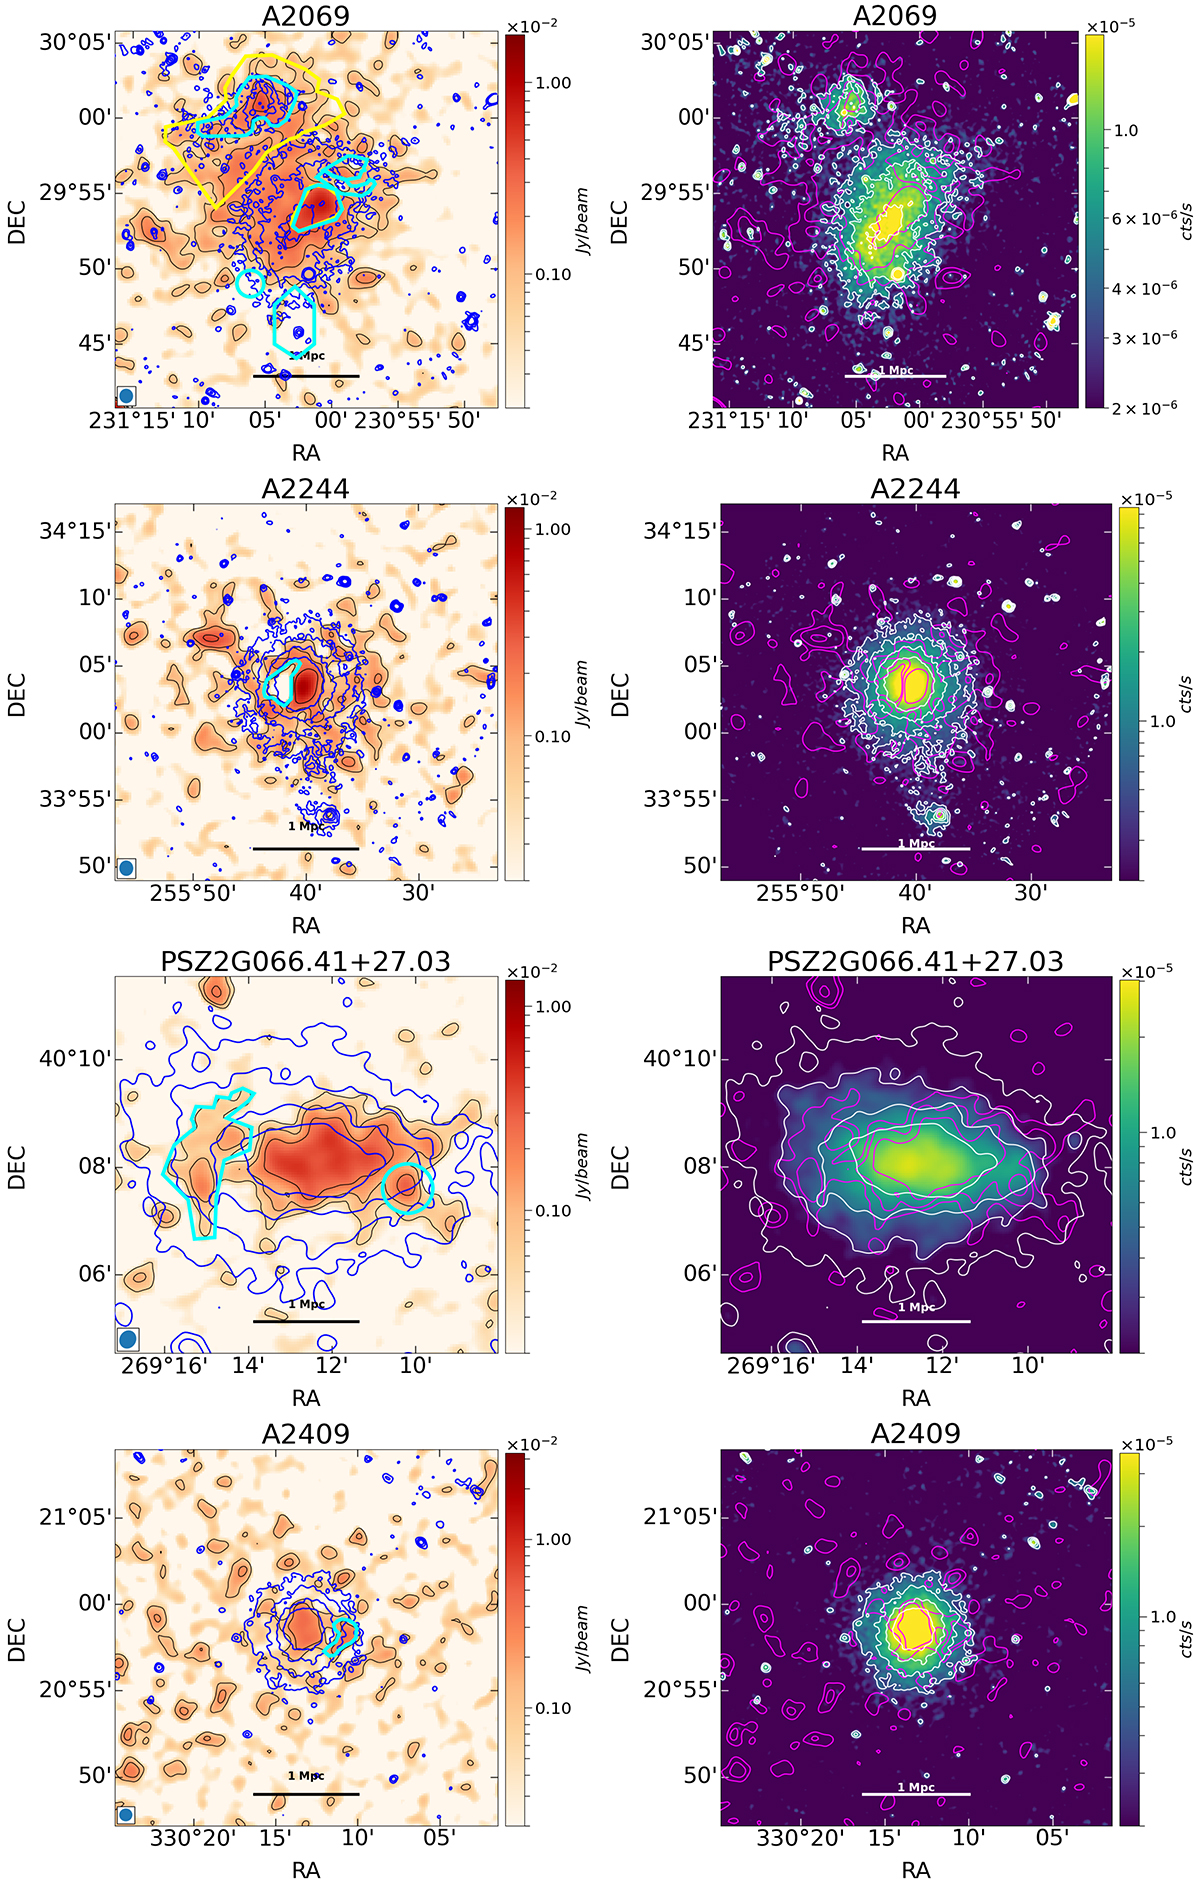
Fig. 1.
Download original image
Radio (left) and X-ray (right) images of A2069, A2244, PSZ2G066.41+27.03, A2409, and A1758. Radio and X-ray contours are present in both images (radio contours in black and magenta; X-ray contours in blue and white). The radio contours are plotted at 2, 4, 8 × σRMS, while the X-ray ones start at a level of 0.2 cts and are spaced with a factor of 2. The excluded regions (see Sect. 4.1) are highlighted in cyan. The radio image resolutions are, respectively, 58, 69, 20, 45, and 30 arcsec. For A2069, we also show a larger yellow region used to mask the entire subcomponent emission, as presented in Sect. 5.1.
Current usage metrics show cumulative count of Article Views (full-text article views including HTML views, PDF and ePub downloads, according to the available data) and Abstracts Views on Vision4Press platform.
Data correspond to usage on the plateform after 2015. The current usage metrics is available 48-96 hours after online publication and is updated daily on week days.
Initial download of the metrics may take a while.