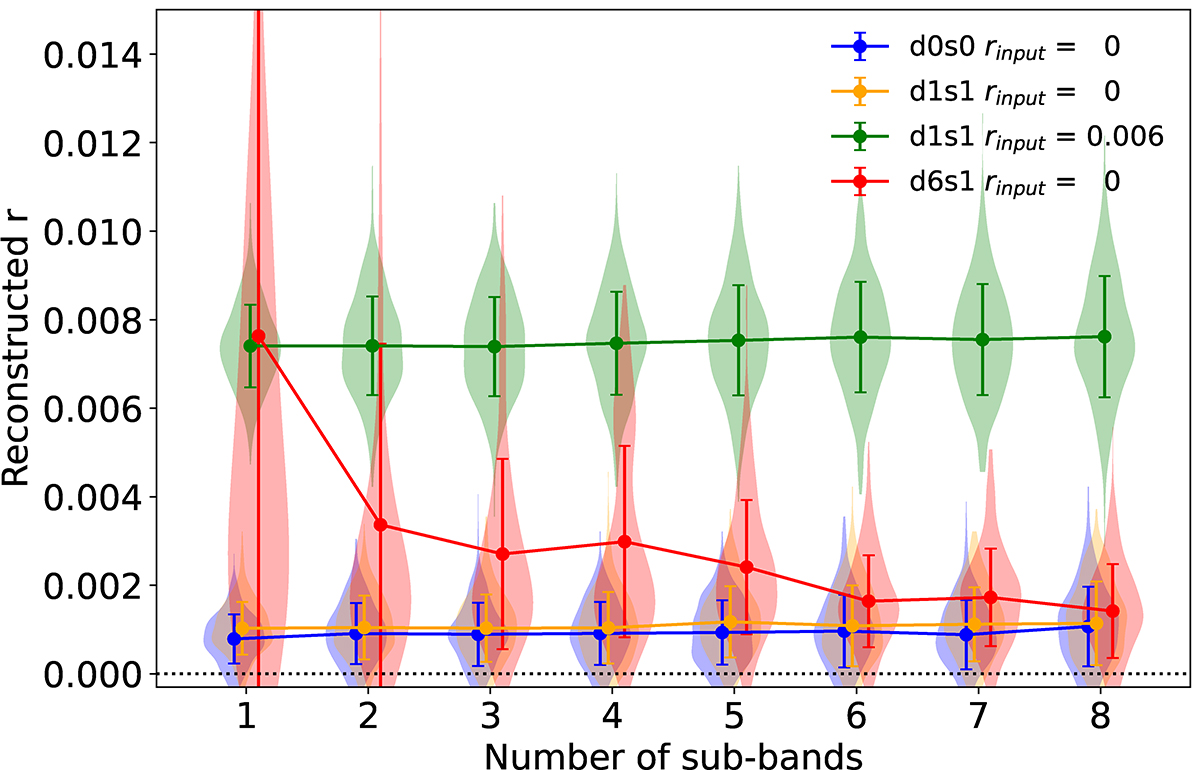
Fig. 7.
Download original image
Average maximum likelihood value of r and the standard deviation as a function of the number of sub-bands in the case of unaccounted-for dust frequency de-correlation (model d6s1 with ℓcorr = 10 and r = 0) compared to two cases of no de-correlation (model d1s1): r = 0 and r = 0.006. On top of the average r values and their standard deviation, we have overplotted the shape of the distribution as a “violin plot.” Note that for the d6 case the distribution is asymmetric for small nsub, so that the average is not centered on the distribution.
Current usage metrics show cumulative count of Article Views (full-text article views including HTML views, PDF and ePub downloads, according to the available data) and Abstracts Views on Vision4Press platform.
Data correspond to usage on the plateform after 2015. The current usage metrics is available 48-96 hours after online publication and is updated daily on week days.
Initial download of the metrics may take a while.