Open Access
Fig. 6.
Download original image
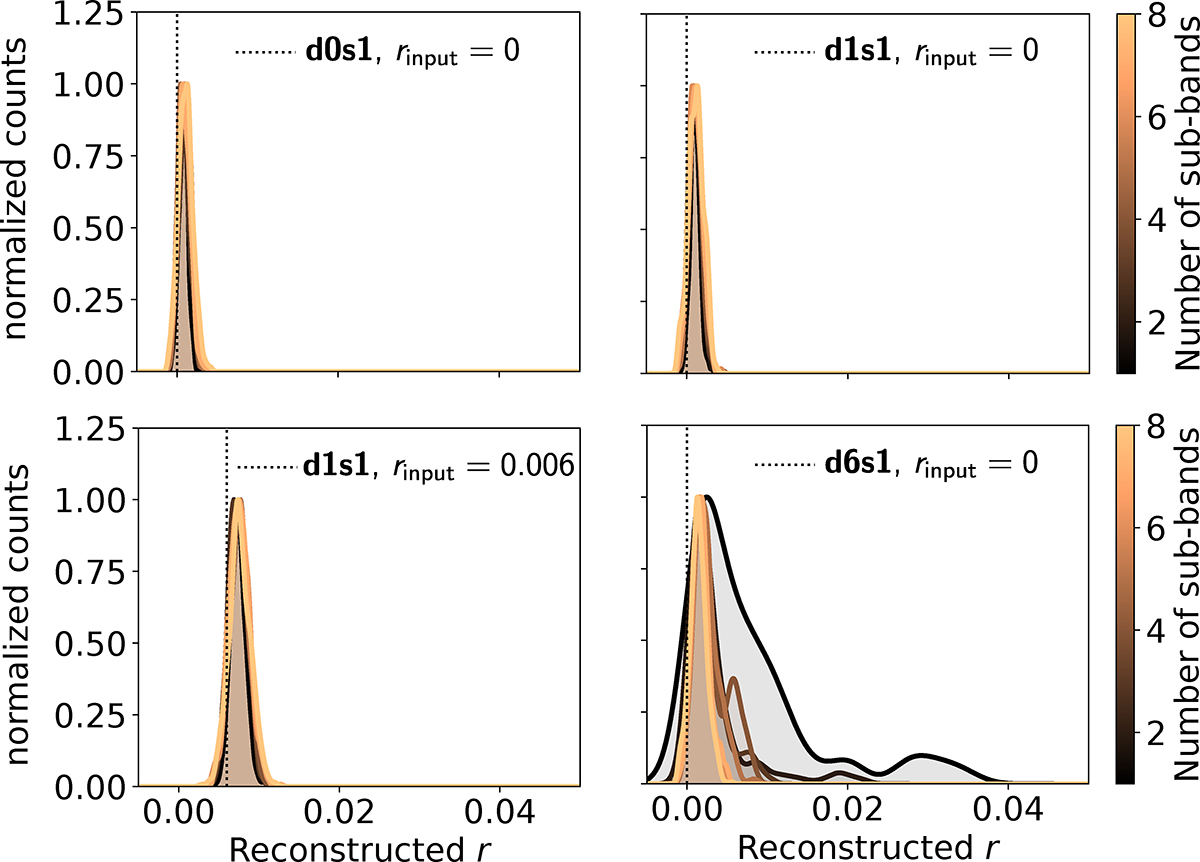
Normalized histograms of the maximum likelihood values of r as a function of the number of sub-bands. Top left: model d0s0 with rinput = 0. Top right: model d1s1 with rinput = 0. Bottom left: model d1s1 with rinput = 0.006. Bottom right: model d6s1 with ℓcorr = 10 and rinput = 0.
Current usage metrics show cumulative count of Article Views (full-text article views including HTML views, PDF and ePub downloads, according to the available data) and Abstracts Views on Vision4Press platform.
Data correspond to usage on the plateform after 2015. The current usage metrics is available 48-96 hours after online publication and is updated daily on week days.
Initial download of the metrics may take a while.