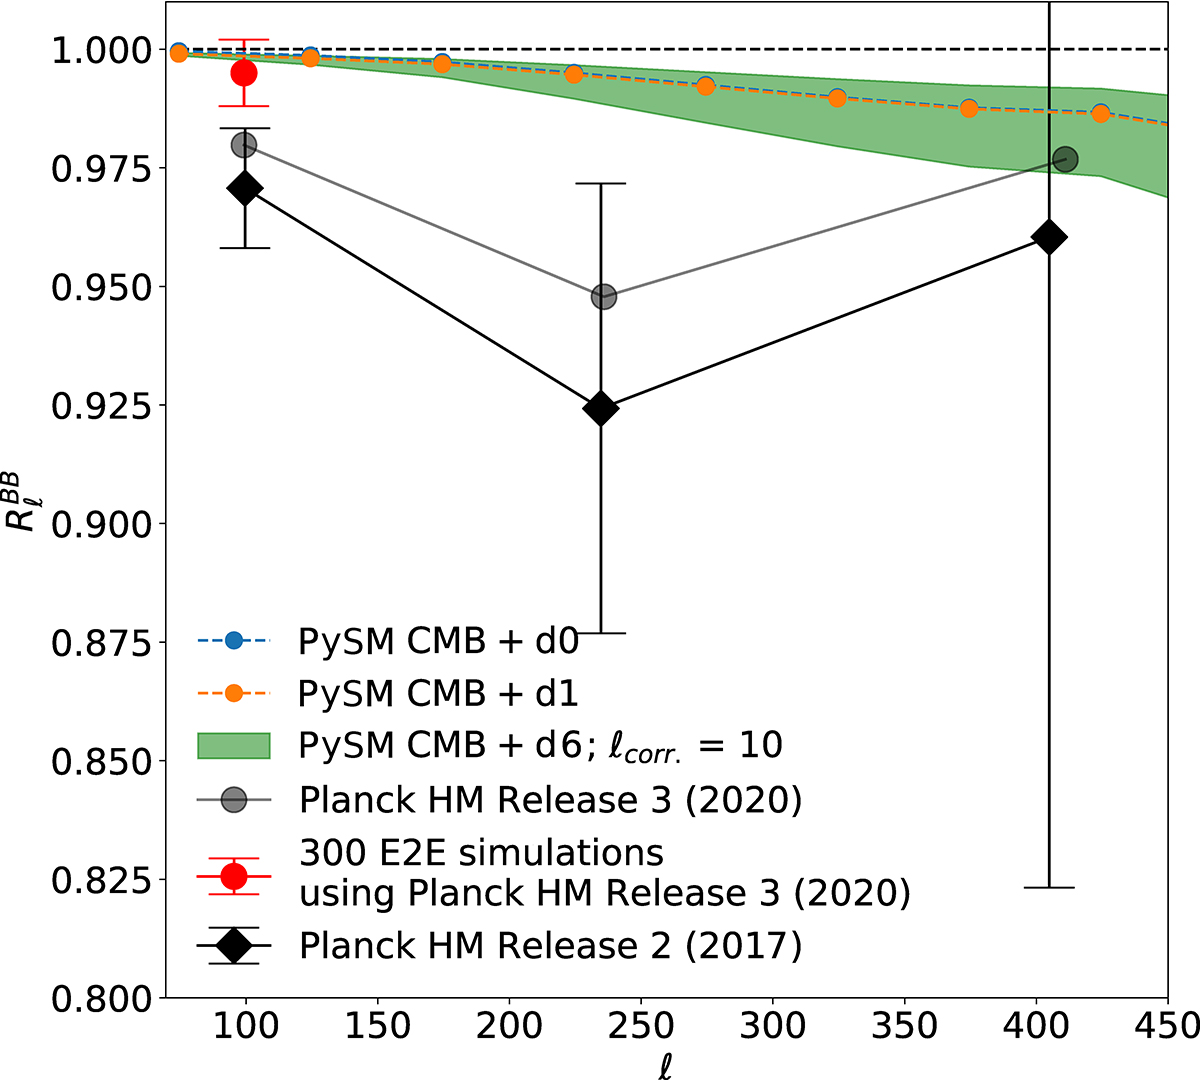
Fig. 4.
Download original image
Correlation ratio measured by Planck from the Half Mission (HM) maps at 217 GHz and 353 GHz, compared to the simulated ratio using PySM dust and CMB templates at the same frequencies. The blue and orange dots represent the expected Rℓ for the CMB and a single MBB dust emission, with constant (d0) or varying pixel-by-pixel (d1) spectral indices, respectively. Note that the dots are so close that they overlap in the figure. The green envelope shows the range of Rℓ obtained from 500 realizations of dust LOS frequency de-correlation with ℓcorr = 10. The black dots are from Fig. 2 of Planck Collaboration Int. L (2017), the gray dots are from Fig. B.2 of Planck Collaboration XI (2020), and the red point is obtained from the values in the middle plot of the second row in Fig. 18 of Planck Collaboration XI (2020).
Current usage metrics show cumulative count of Article Views (full-text article views including HTML views, PDF and ePub downloads, according to the available data) and Abstracts Views on Vision4Press platform.
Data correspond to usage on the plateform after 2015. The current usage metrics is available 48-96 hours after online publication and is updated daily on week days.
Initial download of the metrics may take a while.