Fig. 2.
Download original image
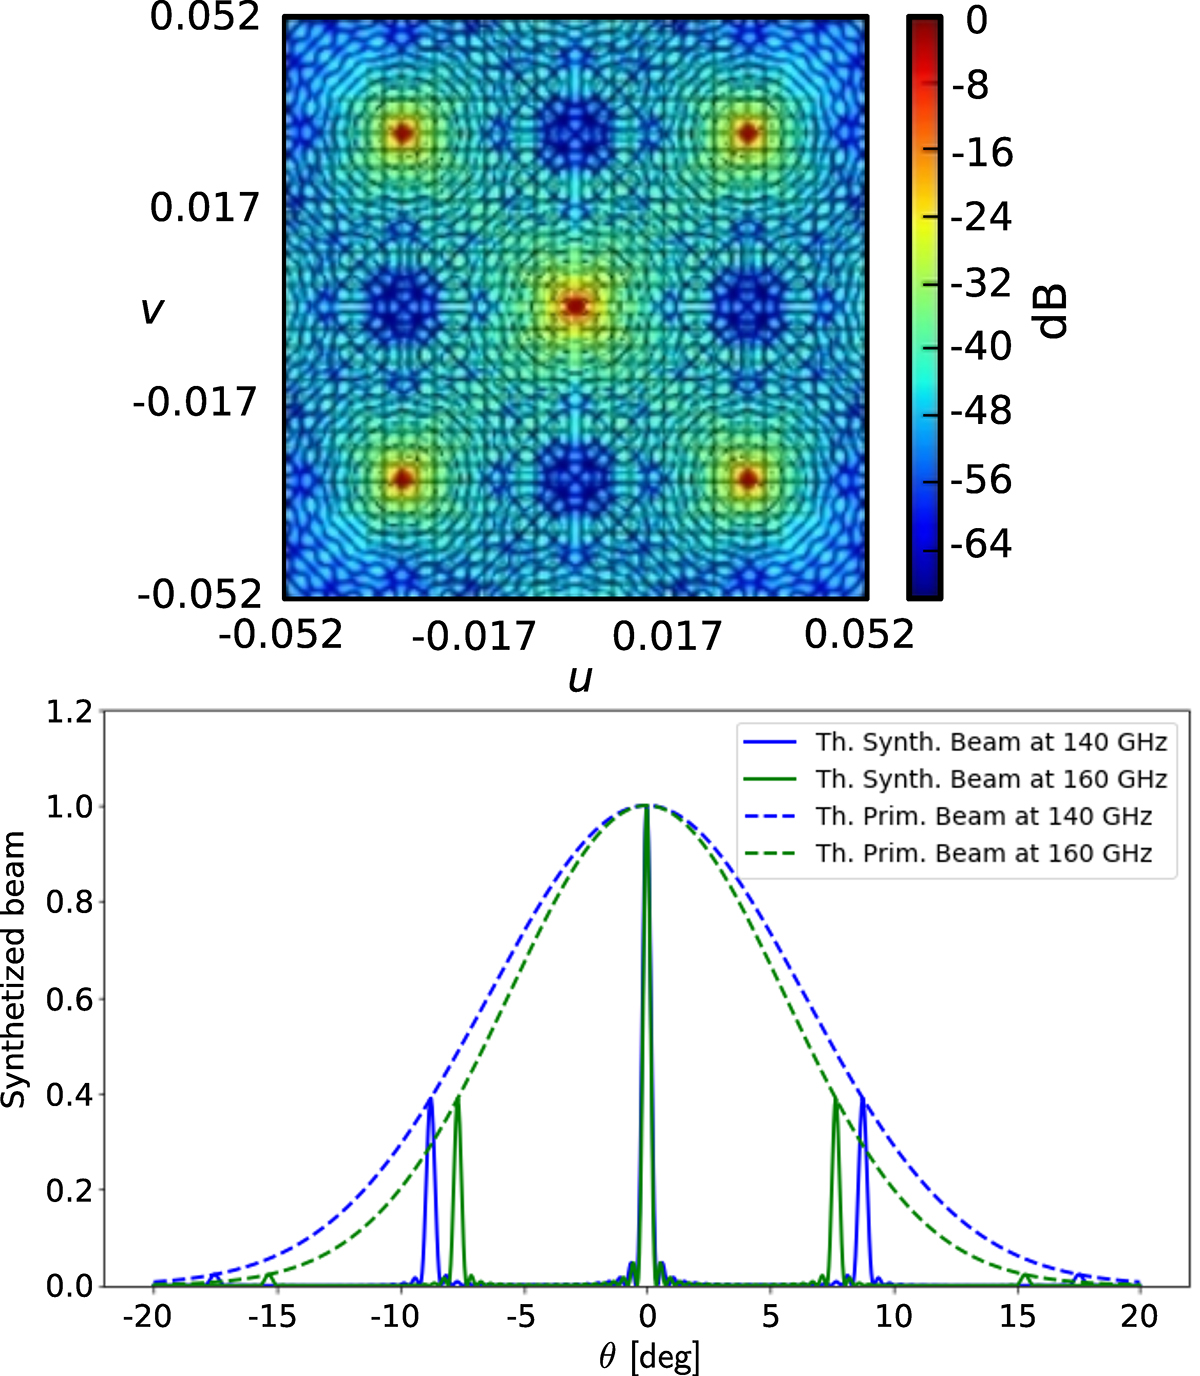
Synthetized beam of QUBIC. Top panel: simulation of the interference pattern on the focal plane generated by a monochromatic point source. Bottom panel: azimuth cut of the theoretical synthesized beam (solid lines) at 140 GHz (blue line) and at 160 GHz (green line) for a detector at the center of the focal plane. Dashed lines represent the beam pattern of a single feed horn. The frequency-dependent position of the secondary peaks is clearly visible.
Current usage metrics show cumulative count of Article Views (full-text article views including HTML views, PDF and ePub downloads, according to the available data) and Abstracts Views on Vision4Press platform.
Data correspond to usage on the plateform after 2015. The current usage metrics is available 48-96 hours after online publication and is updated daily on week days.
Initial download of the metrics may take a while.