Fig. 9.
Download original image
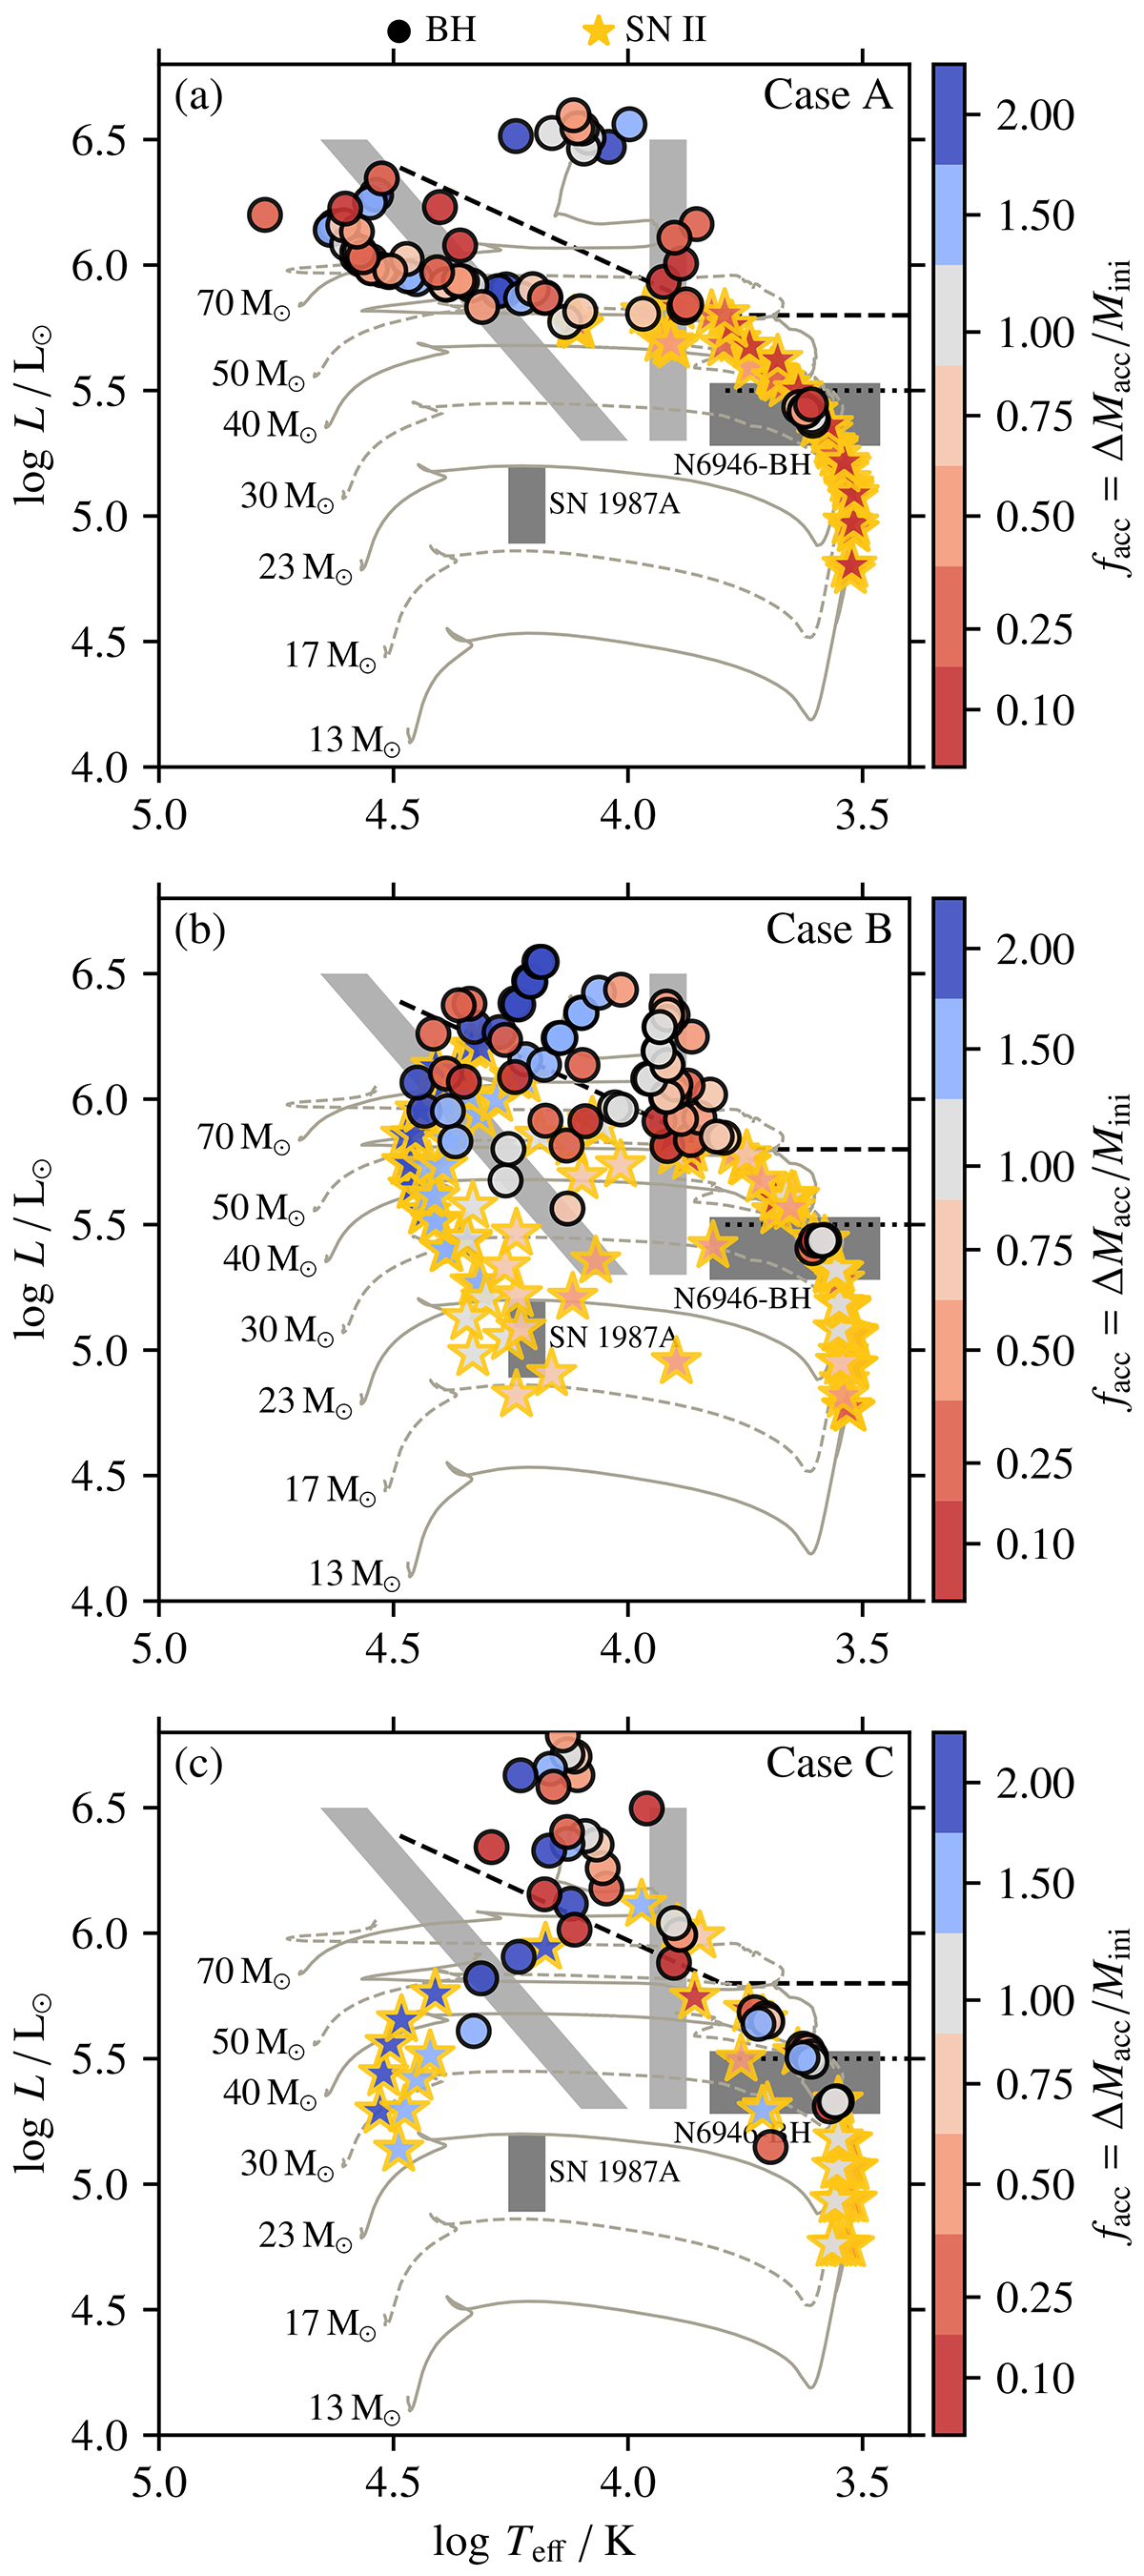
Pre-SN locations of the Cases A–C accretors in the HR diagram. The dotted line at log L/L⊙ = 5.5 (Davies et al. 2018) is the maximum luminosity of RSGs and the grey shaded regions indicate the hot and cool parts of the S Doradus instability strip. The dashed line is the Humphreys–Davidson limit (Humphreys & Davidson 1979). The dark-grey boxes indicate the locations of the RSG N6946-BH that likely collapsed into a BH without a bright SN (Gerke et al. 2015; Adams et al. 2017a,b; Basinger et al. 2021), and the BSG progenitor of SN 1987A (Woosley 1988). The grey evolutionary tracks are single-star models with the masses given by the labels.
Current usage metrics show cumulative count of Article Views (full-text article views including HTML views, PDF and ePub downloads, according to the available data) and Abstracts Views on Vision4Press platform.
Data correspond to usage on the plateform after 2015. The current usage metrics is available 48-96 hours after online publication and is updated daily on week days.
Initial download of the metrics may take a while.