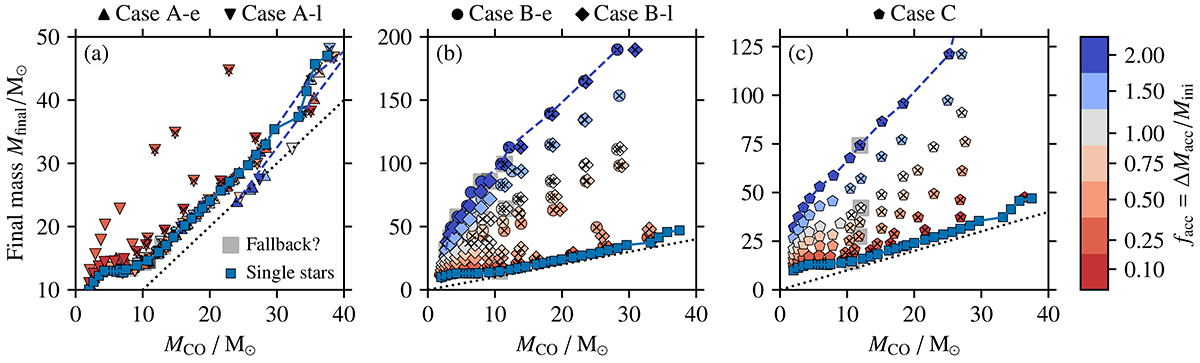
Fig. 6.
Download original image
Similar to Fig. 5 but showing the final masses of stars as a function of the CO core mass MCO at core collapse. In all three panels, single-star models are plotted as blue squares. We further indicate models that experience SN fallback by grey squares while crosses mark those models that should have experienced enhanced LBV-like mass loss, which is not accounted for in our models (see Sect. 2.1). The dotted black line is a one-to-one relation.
Current usage metrics show cumulative count of Article Views (full-text article views including HTML views, PDF and ePub downloads, according to the available data) and Abstracts Views on Vision4Press platform.
Data correspond to usage on the plateform after 2015. The current usage metrics is available 48-96 hours after online publication and is updated daily on week days.
Initial download of the metrics may take a while.