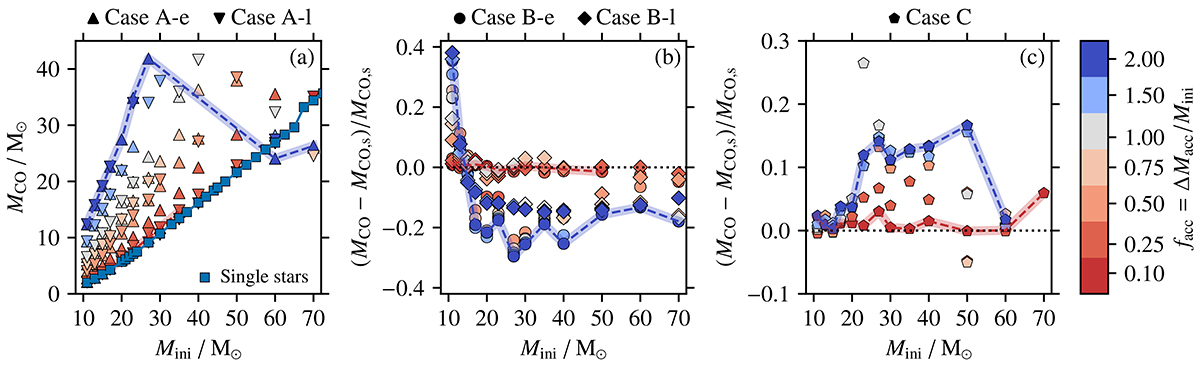
Fig. 5.
Download original image
CO core masses MCO at core collapse as a function of the initial mass Mini for Case A (panel a), Case B (panel b), and Case C (panel c) accretors. Colours show the accretion fraction facc of the models, and single stars are shown in blue squares for comparison in panel a. Panels b and c show the difference in MCO relative to the corresponding single-star core masses. To guide the eye, data points for facc = 0.1 (mostly CSGs) and 2.0 (BSGs) are connected by dashed lines and highlighted.
Current usage metrics show cumulative count of Article Views (full-text article views including HTML views, PDF and ePub downloads, according to the available data) and Abstracts Views on Vision4Press platform.
Data correspond to usage on the plateform after 2015. The current usage metrics is available 48-96 hours after online publication and is updated daily on week days.
Initial download of the metrics may take a while.