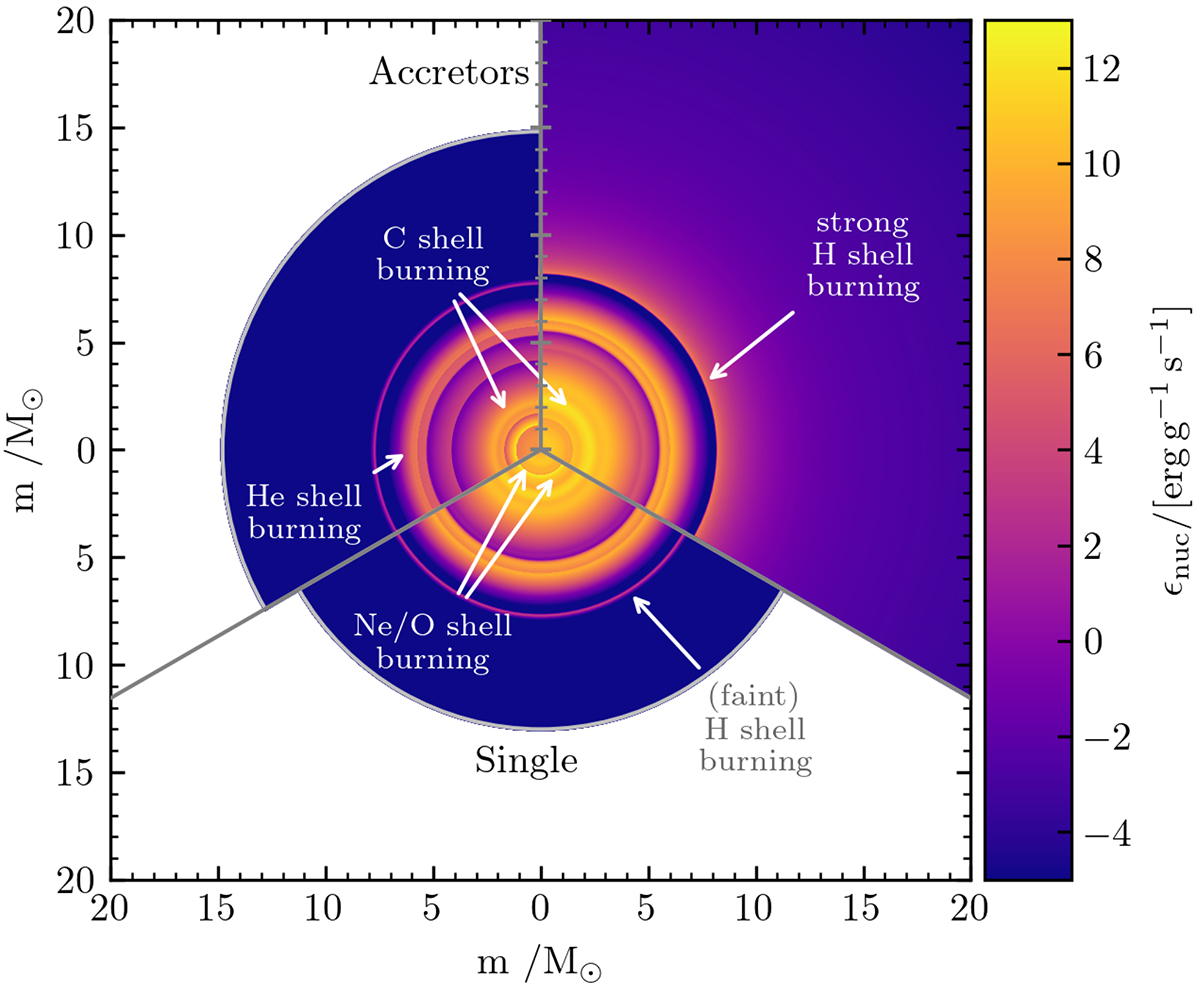
Fig. 3.
Download original image
TULIPS diagram (Laplace 2022) of the nuclear energy generation rate ϵnuc at the end of core oxygen burning (central oxygen mass fraction < 10−4). Shown are the interiors of a single star of Mini = 20 M⊙ (bottom), an early Case B accretor model of Mini = 20 M⊙ and facc = 0.1 (top left), and an early Case B accretor model of Mini = 23 M⊙ and facc = 1.0 (top right). The three models have a similar CO core masses of MCO = 5.62 M⊙, 5.64 M⊙, and 5.89 M⊙, respectively. The facc = 0.1 accretor model is a CSG while the facc = 1.0 model is a BSG, which can be recognised by the strong hydrogen-shell burning that drives a thick convection zone (not indicated here for clarity, but cf. Figs. 2 and A.5).
Current usage metrics show cumulative count of Article Views (full-text article views including HTML views, PDF and ePub downloads, according to the available data) and Abstracts Views on Vision4Press platform.
Data correspond to usage on the plateform after 2015. The current usage metrics is available 48-96 hours after online publication and is updated daily on week days.
Initial download of the metrics may take a while.