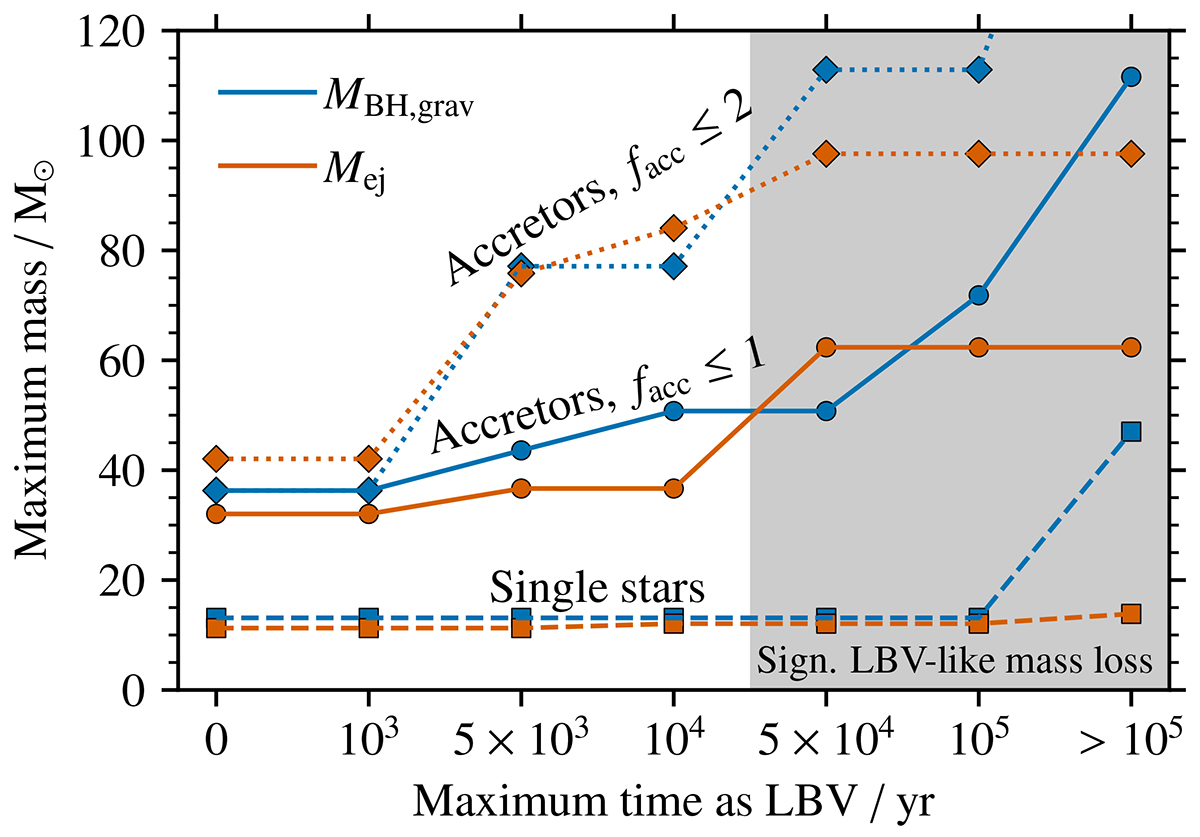
Fig. 16.
Download original image
Maximum BH and SN ejecta mass of single stars and accretors with facc ≤ 1.0 and facc ≤ 2.0 as a function of the maximum time spent in the LBV region of the HR diagram. The grey-shaded region indicates models for which we expect significant LBV-like mass loss such that the maximum BH and SN ejecta masses should be considered upper limits.
Current usage metrics show cumulative count of Article Views (full-text article views including HTML views, PDF and ePub downloads, according to the available data) and Abstracts Views on Vision4Press platform.
Data correspond to usage on the plateform after 2015. The current usage metrics is available 48-96 hours after online publication and is updated daily on week days.
Initial download of the metrics may take a while.