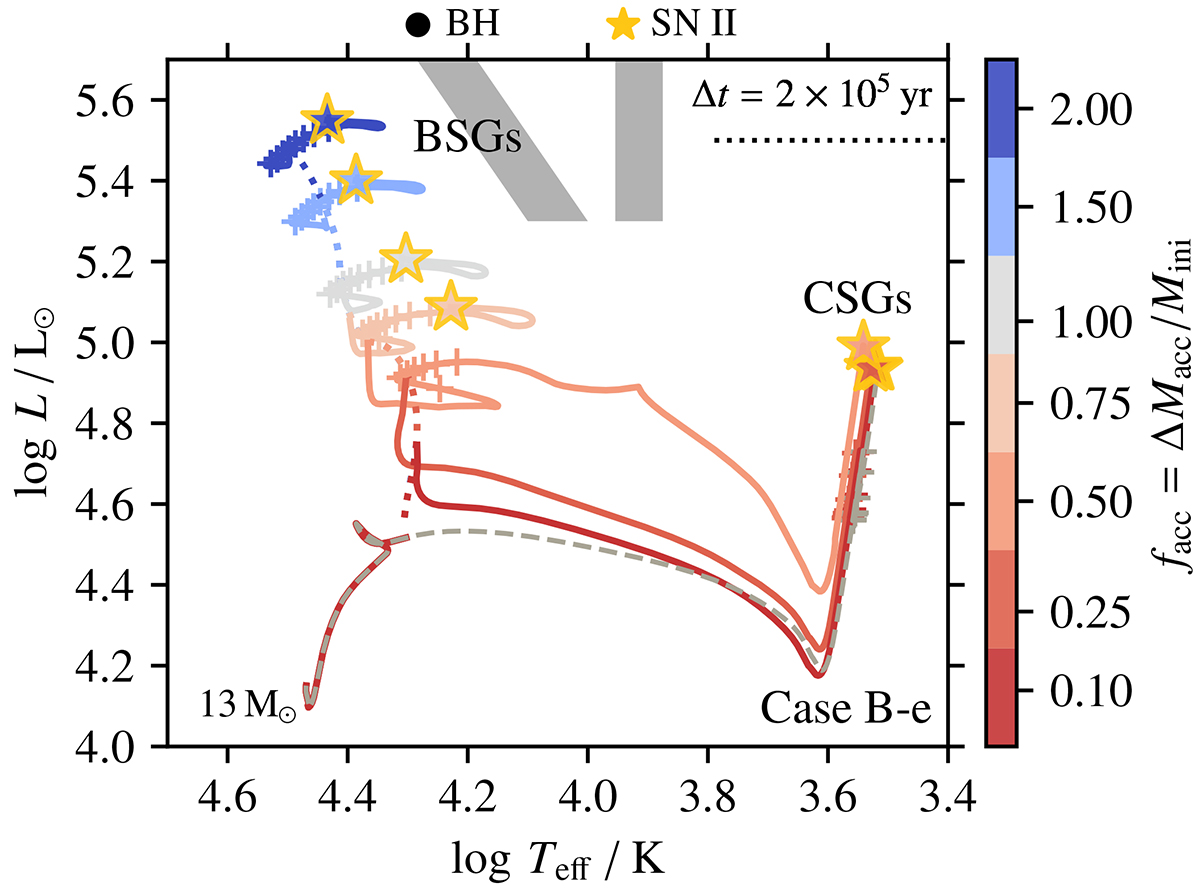
Fig. 1.
Download original image
Hertzspung-Russell diagram with initial 13 M⊙ stars accreting a fraction facc of their initial mass (colour coded) shortly after they finished core hydrogen burning (early Case B). The dotted parts of the tracks show the accretion phase and the dashed grey evolutionary track is for a single star. Plus symbols are added every 2 × 10⁵ yr after finishing core hydrogen burning to indicate in which region of the HR diagram stars burn helium in the core. The observationally inferred maximum luminosity of RSGs of log L/L⊙ = 5.5 (Davies et al. 2018) is shown by a dotted black line. Explosion sites are indicated as well as the likely SN type. The grey bands show the hot and cool part of the S Doradus instability strip (Smith et al. 2004). For facc ≳ 0.50, the models burn helium as a BSG and for facc ≳ 0.75 they also explode as a BSG.
Current usage metrics show cumulative count of Article Views (full-text article views including HTML views, PDF and ePub downloads, according to the available data) and Abstracts Views on Vision4Press platform.
Data correspond to usage on the plateform after 2015. The current usage metrics is available 48-96 hours after online publication and is updated daily on week days.
Initial download of the metrics may take a while.