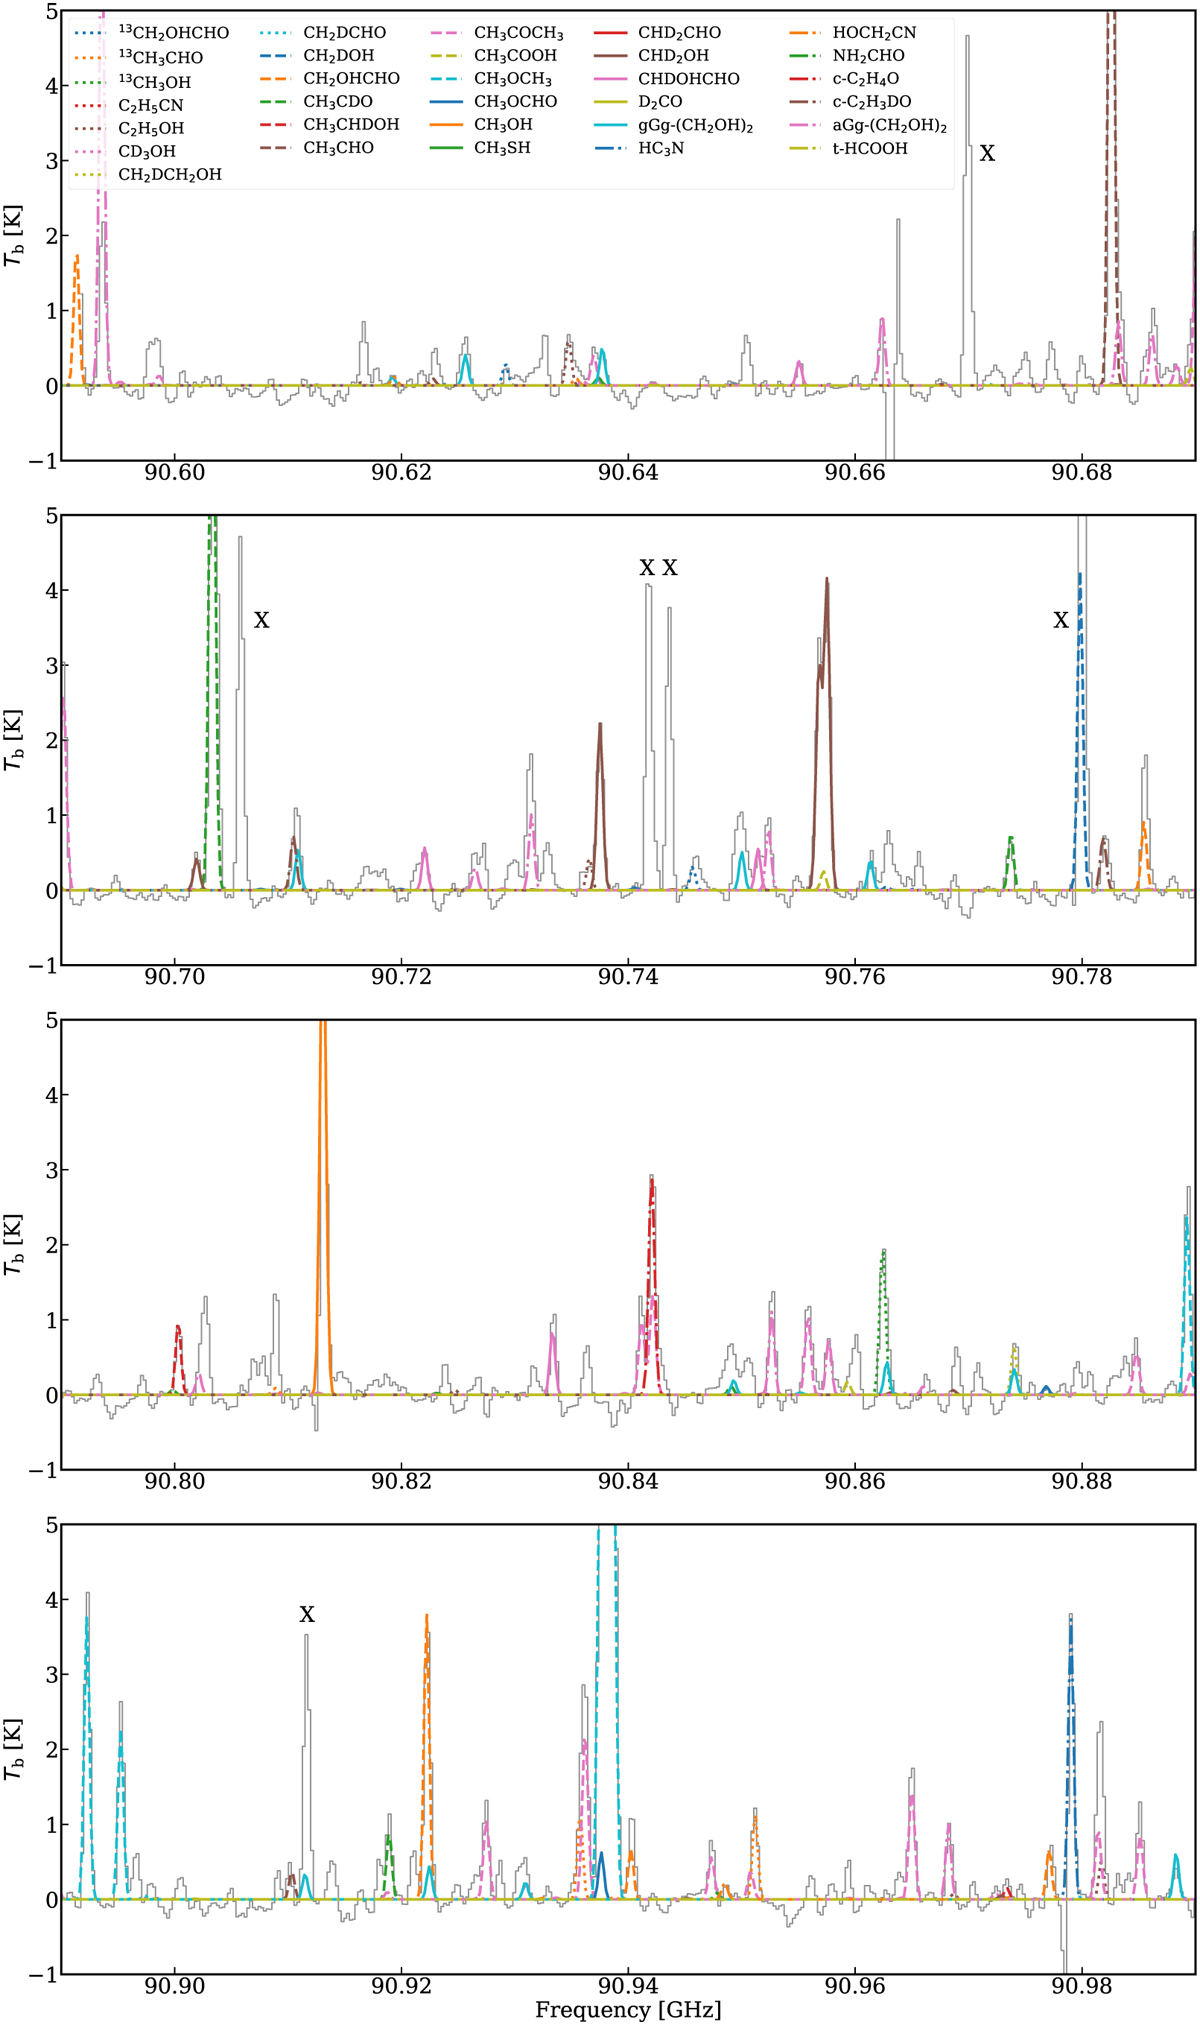
Fig. B.1
Download original image
Fitted model for each molecule on top of the Band 3 data in gray. For readability, the y-axis limit was set to 5 K; however, no line was overestimated except those of methanol and one line of aGg′-(CH2OH)2, which are potentially optically thick. The lines that have an intensity higher than 2 K (i.e., detected at a ≳7 − 10σ level) but that were not identified are indicated by an “X”.
Current usage metrics show cumulative count of Article Views (full-text article views including HTML views, PDF and ePub downloads, according to the available data) and Abstracts Views on Vision4Press platform.
Data correspond to usage on the plateform after 2015. The current usage metrics is available 48-96 hours after online publication and is updated daily on week days.
Initial download of the metrics may take a while.