Fig. 6
Download original image
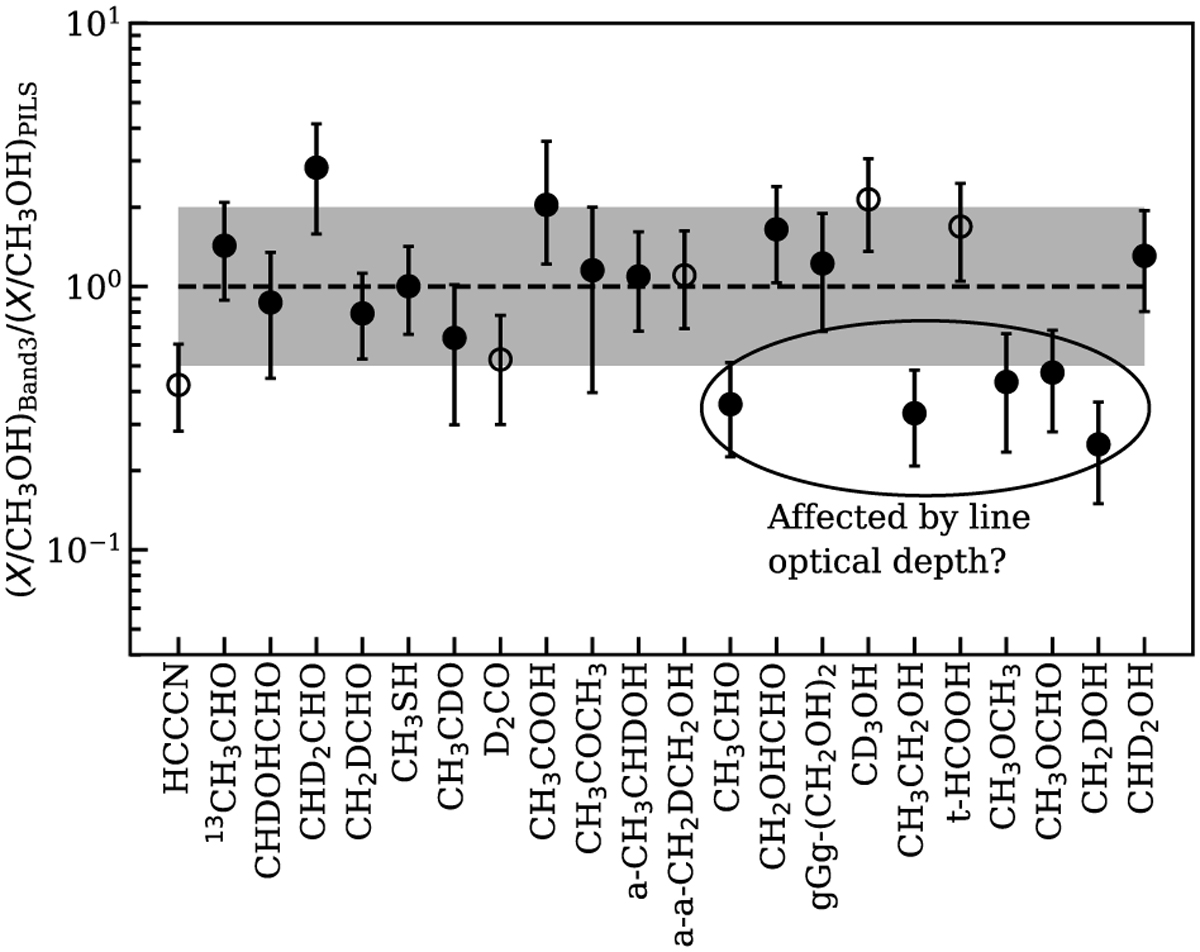
Ratio between Band 3 and PILS column density ratios with respect to methanol (i.e., the ratio of blue to pink from the left panel of Fig. 2). The horizontal dashed line indicates where the ratio between Band 3 and PILS are the same. The shaded gray area indicates the region with a factor of two difference between Band 3 and PILS results. The species are ordered in the same way as in the left panel of Fig. 2. The hollow symbols show the species that have only one detected line.
Current usage metrics show cumulative count of Article Views (full-text article views including HTML views, PDF and ePub downloads, according to the available data) and Abstracts Views on Vision4Press platform.
Data correspond to usage on the plateform after 2015. The current usage metrics is available 48-96 hours after online publication and is updated daily on week days.
Initial download of the metrics may take a while.