Fig. 5
Download original image
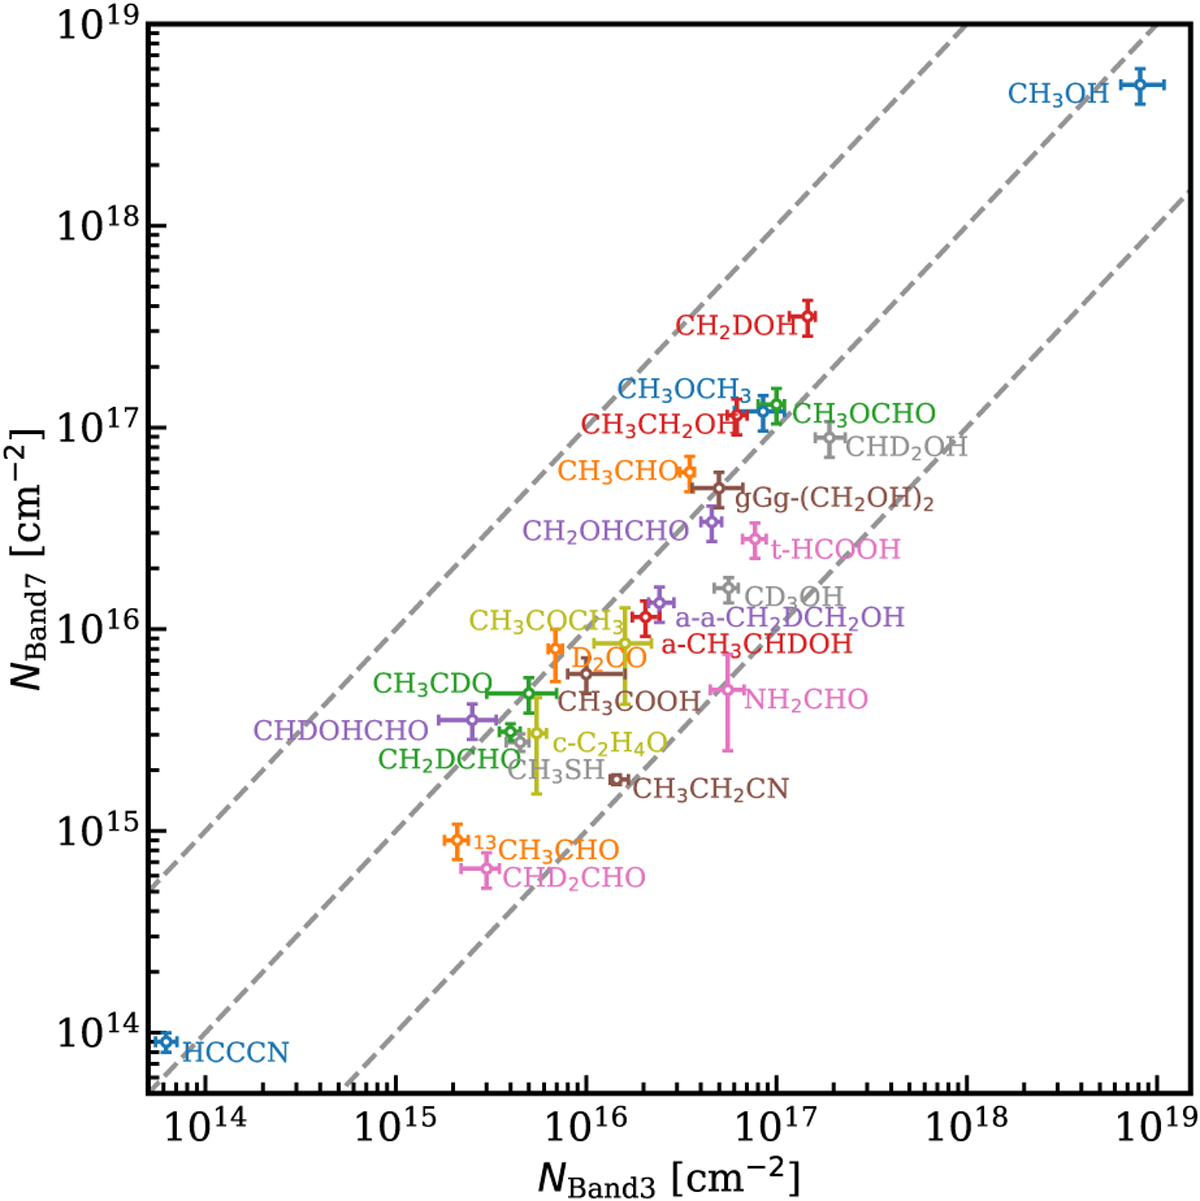
Column density of the various molecules from the ALMA Band 7 observations (PILS; ~345 GHz) as a function of those from Band 3 (~100 GHz). Beam dilution was corrected for the column densities in this figure. Dashed lines present where the values of the y-axis are the same as the values of the x-axis, where they are ten times higher and ten times lower than the values of the x-axis.
Current usage metrics show cumulative count of Article Views (full-text article views including HTML views, PDF and ePub downloads, according to the available data) and Abstracts Views on Vision4Press platform.
Data correspond to usage on the plateform after 2015. The current usage metrics is available 48-96 hours after online publication and is updated daily on week days.
Initial download of the metrics may take a while.