Fig. 3
Download original image
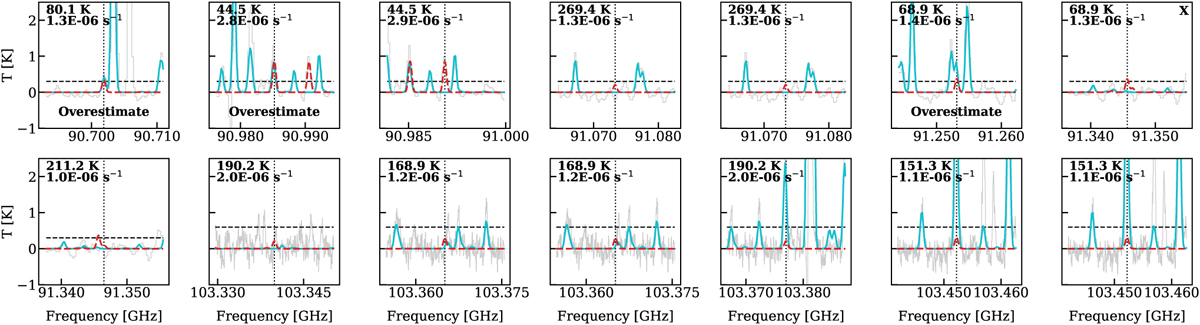
Lines of g-Isopropanol and the model for its upper limit in red dashed lines (1.5 × 1016 cm−2). Gray is the data and cyan is the total fitted model from the detected and tentatively detected species. The vertical dotted lines show the transition frequency of each line. The Eup and Aij are printed in the top left of each panel. The line that was used to find the 3σ upper limit is indicated by an “X” in the top right. The horizontal dashed lines show the 3σ level. Only lines with Aij > 10−6 s−1 and Eup < 300 K are shown.
Current usage metrics show cumulative count of Article Views (full-text article views including HTML views, PDF and ePub downloads, according to the available data) and Abstracts Views on Vision4Press platform.
Data correspond to usage on the plateform after 2015. The current usage metrics is available 48-96 hours after online publication and is updated daily on week days.
Initial download of the metrics may take a while.