Fig. 2
Download original image
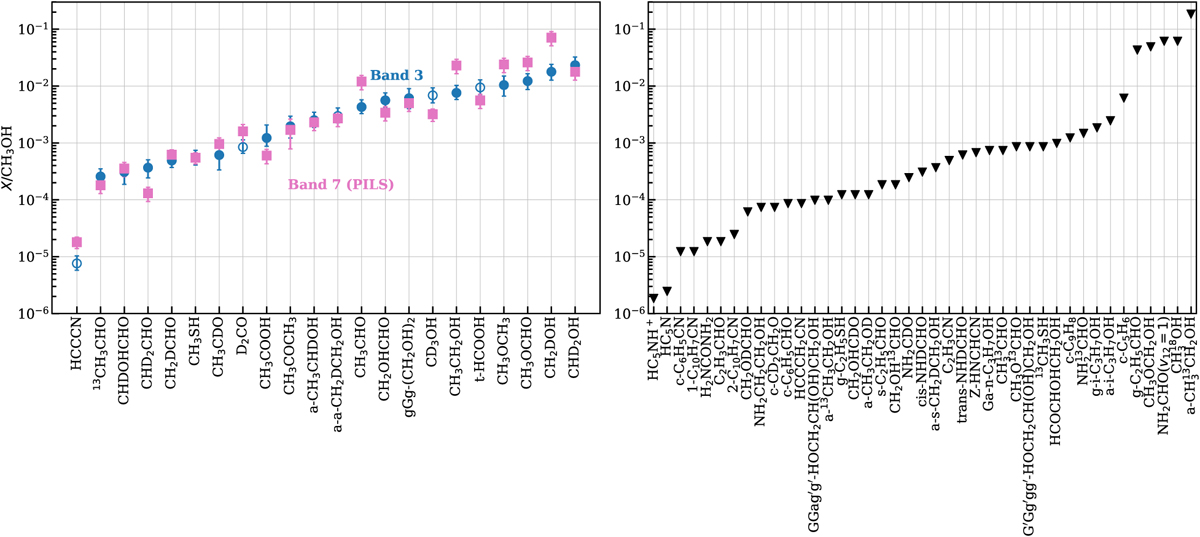
Column density ratios of detected species and upper limits with respect to methanol. Left: column density ratios for the detected species with respect to methanol for our Band 3 data (blue). The same ratios from PILS in Band 7 (pink) are also shown for comparison (see the text for references). The hollow symbols show the species that only have one detected line. Right: ratios of the upper limits measured in this work (Table B.1) with respect to methanol. In both panels, the species are ordered from left to right by increasing Band 3 ratios with respect to methanol.
Current usage metrics show cumulative count of Article Views (full-text article views including HTML views, PDF and ePub downloads, according to the available data) and Abstracts Views on Vision4Press platform.
Data correspond to usage on the plateform after 2015. The current usage metrics is available 48-96 hours after online publication and is updated daily on week days.
Initial download of the metrics may take a while.