Fig. B.5
Download original image
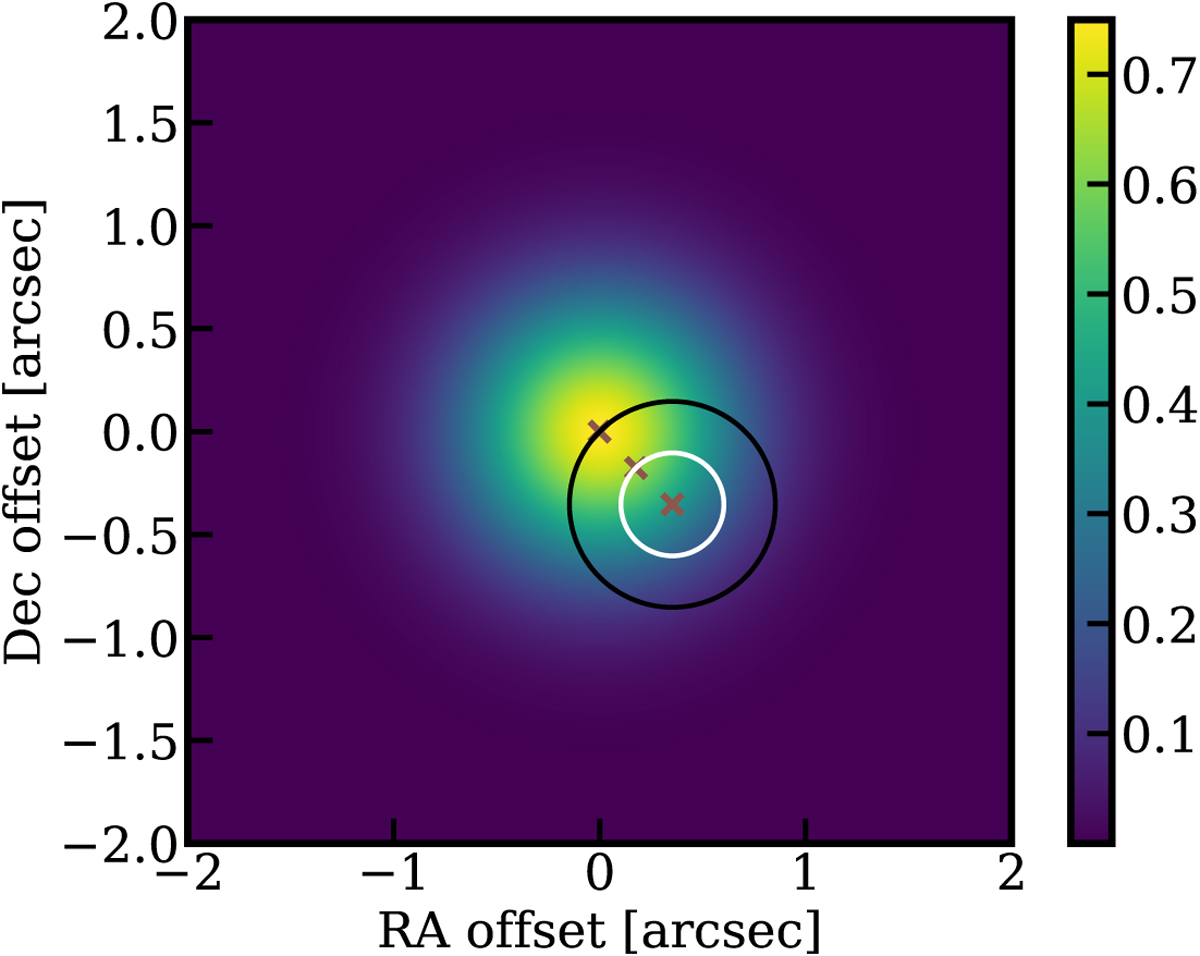
Two-dimensional Gaussian function with a total integration of one and a FWHM of 0.5″ (color scale). This was assumed as a typical emission distribution for COMs based on the results of PILS (e.g., Jørgensen et al. 2016). Two circular regions with radii of 0.25″ and 0.5″ are overplotted, representing beams of PILS (white) and Band 3 (black), respectively. The crosses show the peak position, 0.25″, and 0.5″ offset positions.
Current usage metrics show cumulative count of Article Views (full-text article views including HTML views, PDF and ePub downloads, according to the available data) and Abstracts Views on Vision4Press platform.
Data correspond to usage on the plateform after 2015. The current usage metrics is available 48-96 hours after online publication and is updated daily on week days.
Initial download of the metrics may take a while.