Fig. 1
Download original image
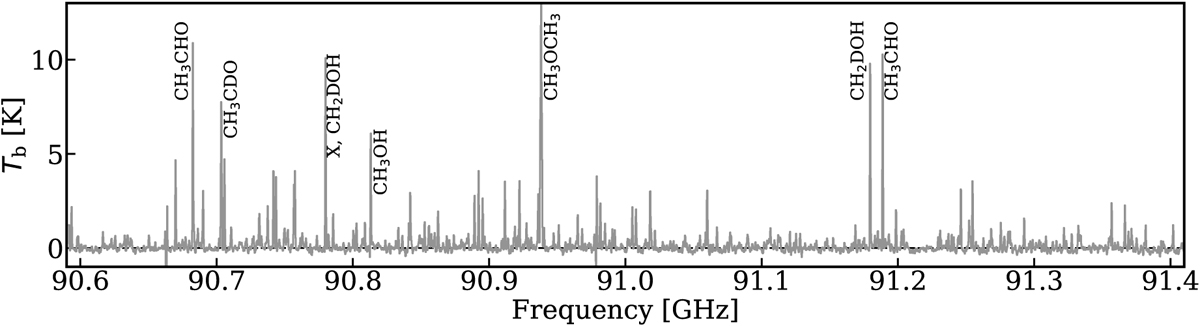
Spectrum of IRAS16293 B Band 3 data for the continuum window. A few strong lines are highlighted; for the full line identification and fitting, readers can refer to Fig. B.1. We note that “X” indicates a line that has not been identified yet and that was not (fully) fitted with the considered molecules for this work. The spectrum of IRAS16293 B is line rich even at ALMA Band 3 wavelengths (~3 mm).
Current usage metrics show cumulative count of Article Views (full-text article views including HTML views, PDF and ePub downloads, according to the available data) and Abstracts Views on Vision4Press platform.
Data correspond to usage on the plateform after 2015. The current usage metrics is available 48-96 hours after online publication and is updated daily on week days.
Initial download of the metrics may take a while.