Fig. 5
Download original image
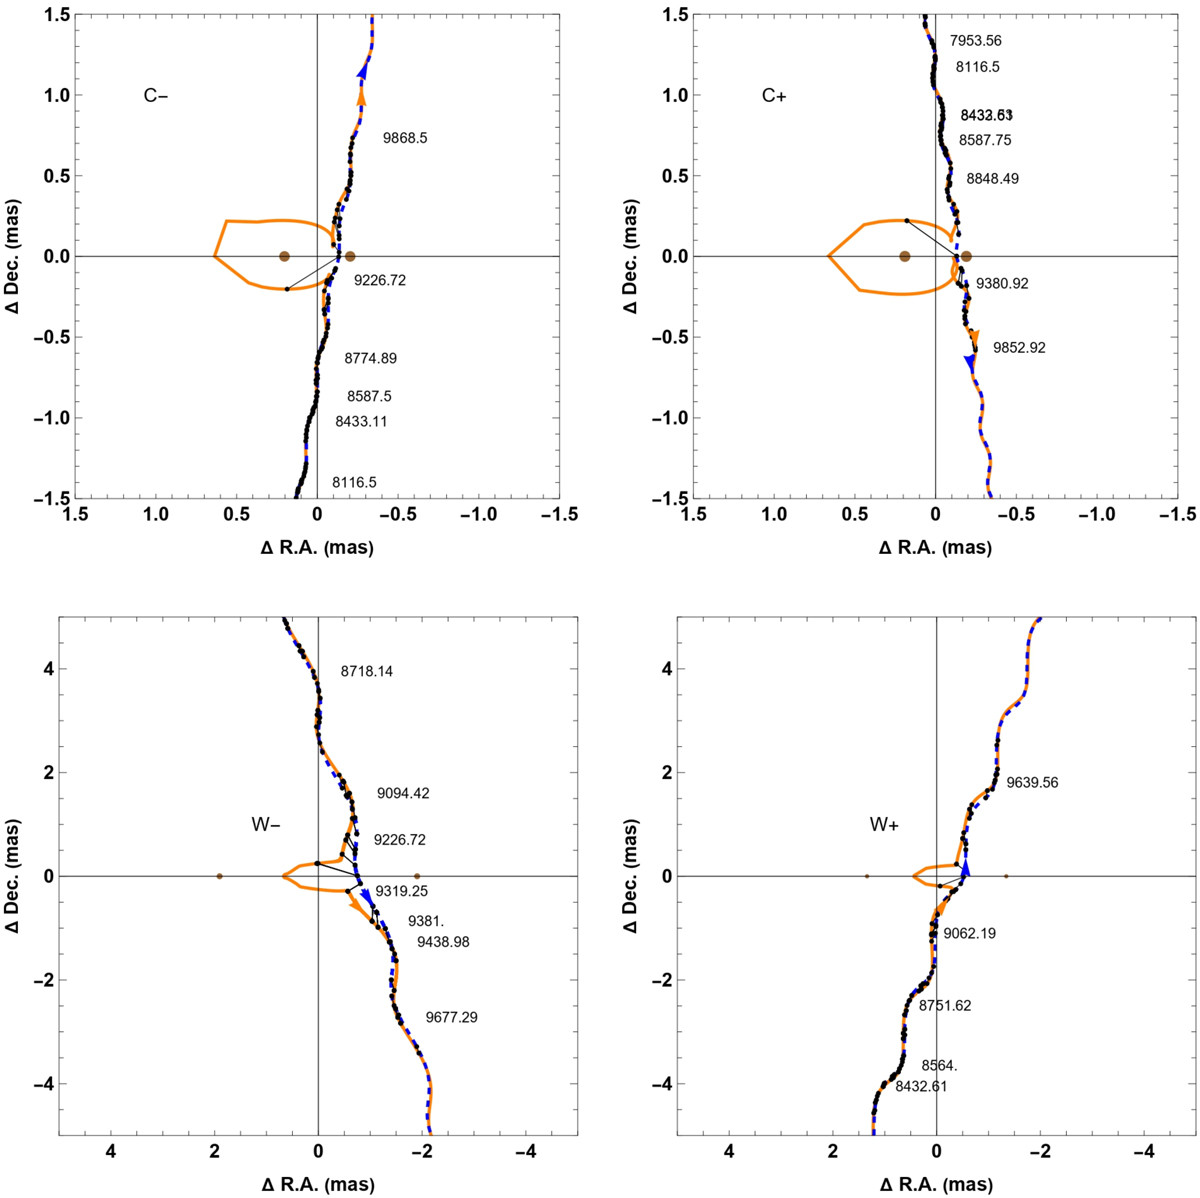
Astrometry simulation for all the models. The blue dashed curve is the source trajectory in a frame in which the lenses are fixed. The orange curve shows the photo-centroid trajectory. The two brown disks are the two lenses and the black points represent the Gaia data points. For all the models, the lens flux considered is obtained by the overlap of the two constraints of finite source effects and blend flux.
Current usage metrics show cumulative count of Article Views (full-text article views including HTML views, PDF and ePub downloads, according to the available data) and Abstracts Views on Vision4Press platform.
Data correspond to usage on the plateform after 2015. The current usage metrics is available 48-96 hours after online publication and is updated daily on week days.
Initial download of the metrics may take a while.