Fig. 4
Download original image
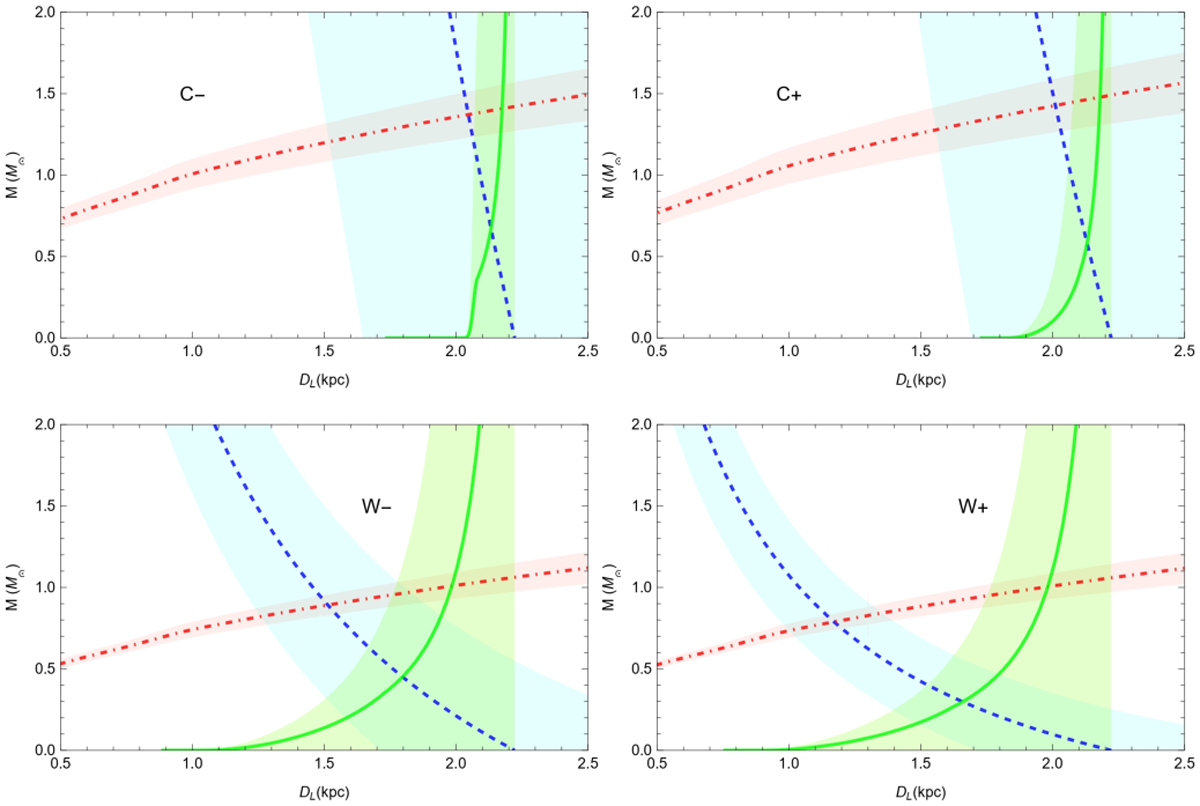
M–DL region for all the models. The blue stripe with the dashed line represents the M–DL relation obtained by microlensing parallax (πE). The red stripe with the dot-dashed line shows the constraint from the lens flux, for which the MLRs for low-mass stars are used. The green stripe with the continuous line exhibits the constraint obtained from the finite-source effects (Boyajian et al. 2014) and the angular radius of the source. All the stripes have a range of 1σ.
Current usage metrics show cumulative count of Article Views (full-text article views including HTML views, PDF and ePub downloads, according to the available data) and Abstracts Views on Vision4Press platform.
Data correspond to usage on the plateform after 2015. The current usage metrics is available 48-96 hours after online publication and is updated daily on week days.
Initial download of the metrics may take a while.