Fig. 3
Download original image
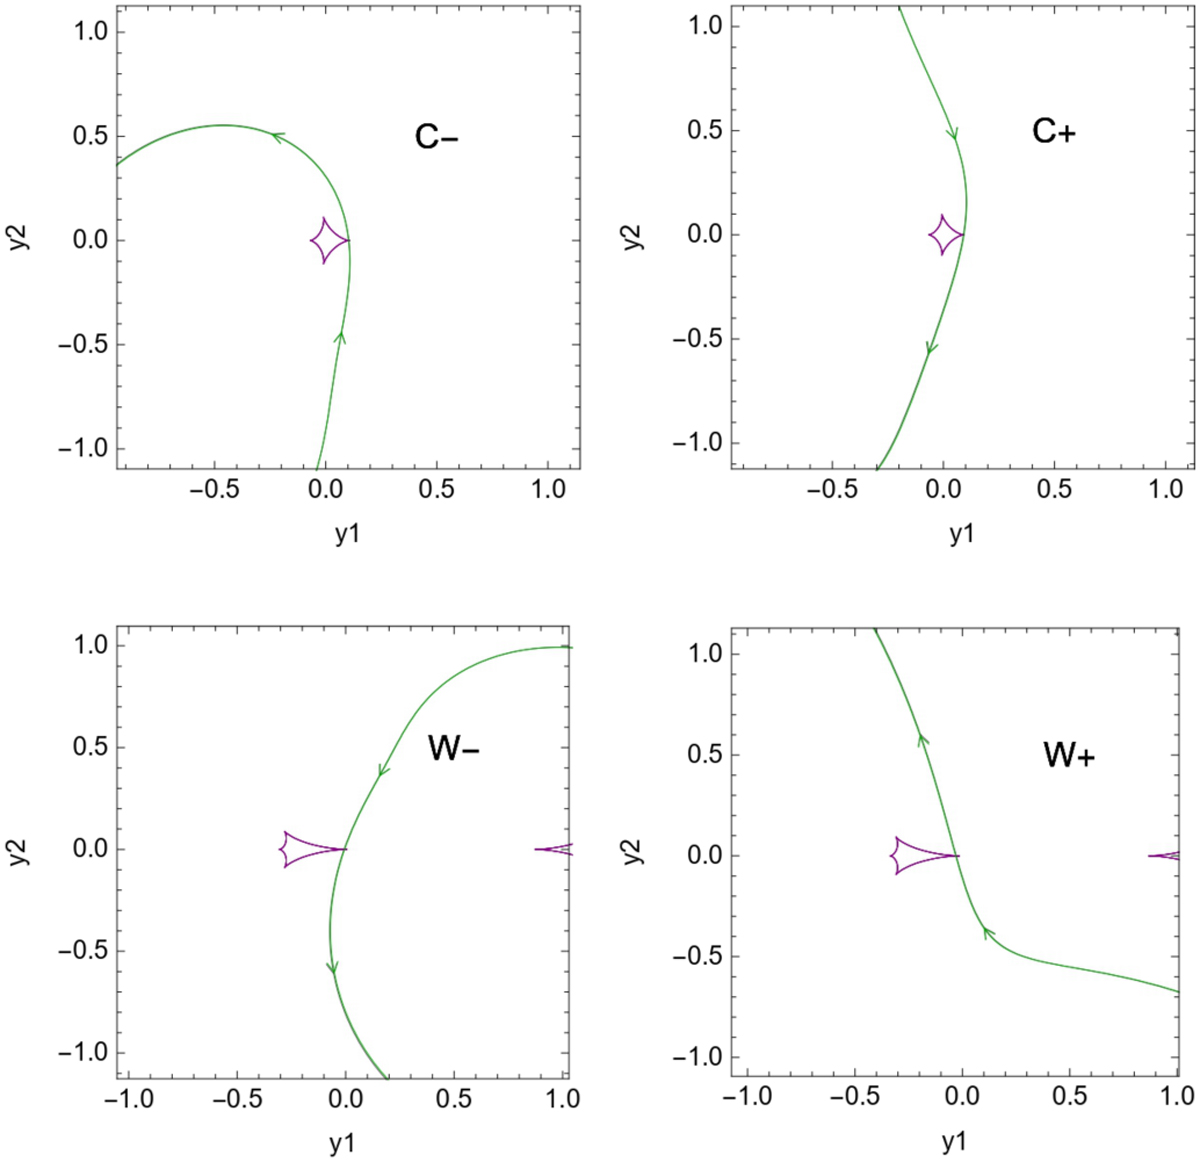
Caustic configuration (in purple) for all the models with the source trajectories (green lines with arrows). At the top lies C− on the left, and on the right lies C+. At the bottom on the left lies the W− model, and the W+ model is shown on the right. The coordinates are centered with respect to the center of mass of the two lenses and are in units of θE.
Current usage metrics show cumulative count of Article Views (full-text article views including HTML views, PDF and ePub downloads, according to the available data) and Abstracts Views on Vision4Press platform.
Data correspond to usage on the plateform after 2015. The current usage metrics is available 48-96 hours after online publication and is updated daily on week days.
Initial download of the metrics may take a while.