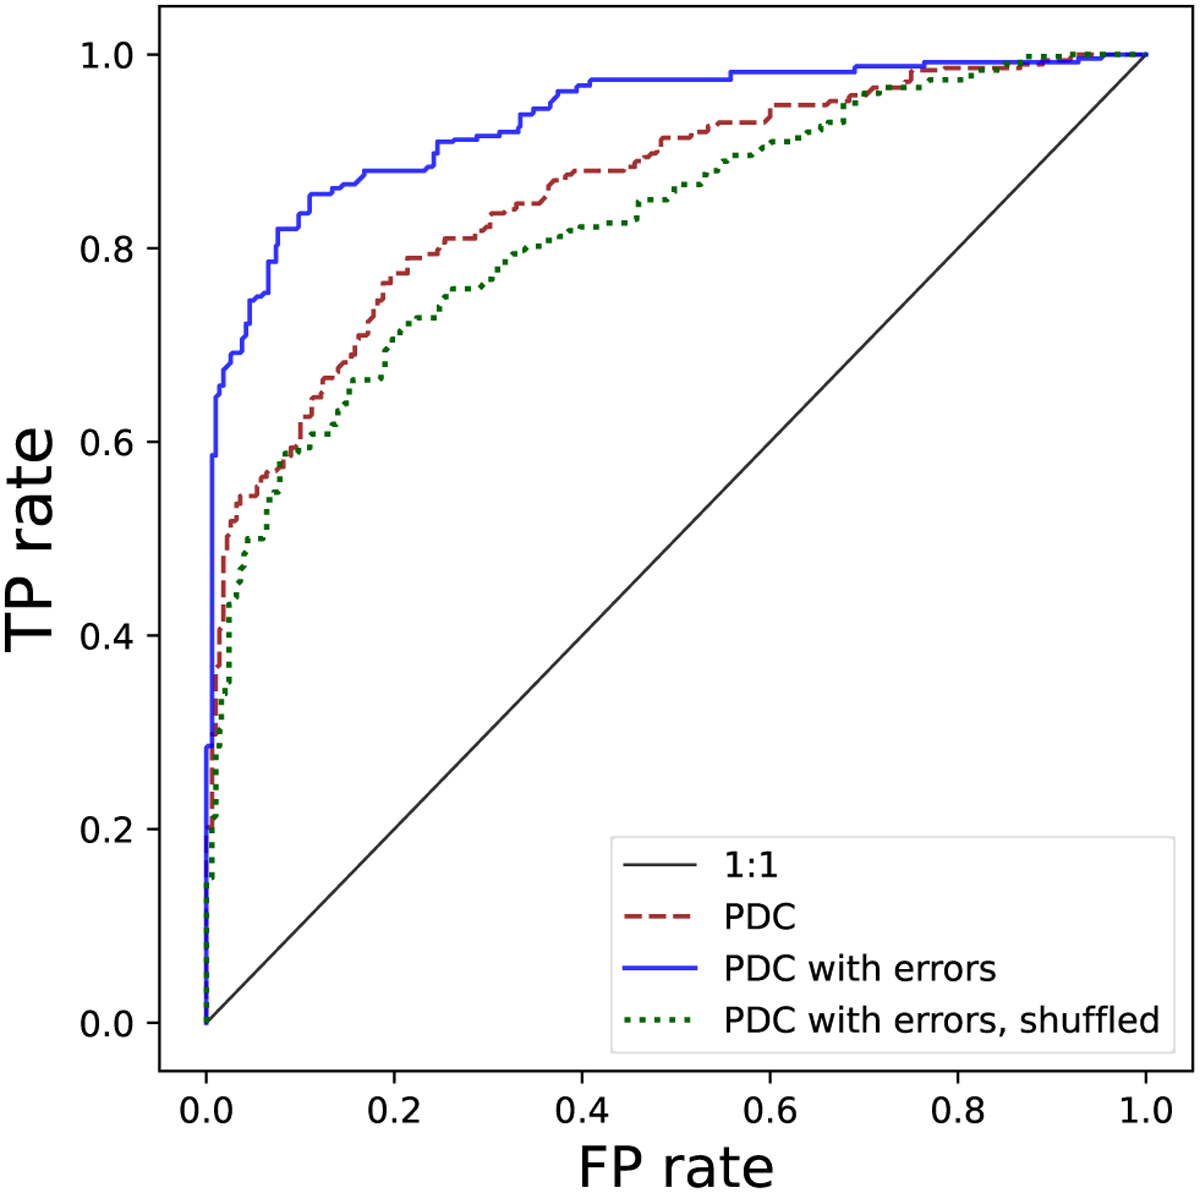
Fig. 6
Download original image
ROC curves comparing our newly developed method in its standard configuration against a scenario where the uncertainty estimates were randomly shuffled. The dashed red line represents the regular PDC, and the solid blue line represents the new version. The green dotted line represents the performance with the randomly shuffled uncertainty estimates. The thin black line represents a random guess.
Current usage metrics show cumulative count of Article Views (full-text article views including HTML views, PDF and ePub downloads, according to the available data) and Abstracts Views on Vision4Press platform.
Data correspond to usage on the plateform after 2015. The current usage metrics is available 48-96 hours after online publication and is updated daily on week days.
Initial download of the metrics may take a while.