Open Access
Fig. 5
Download original image
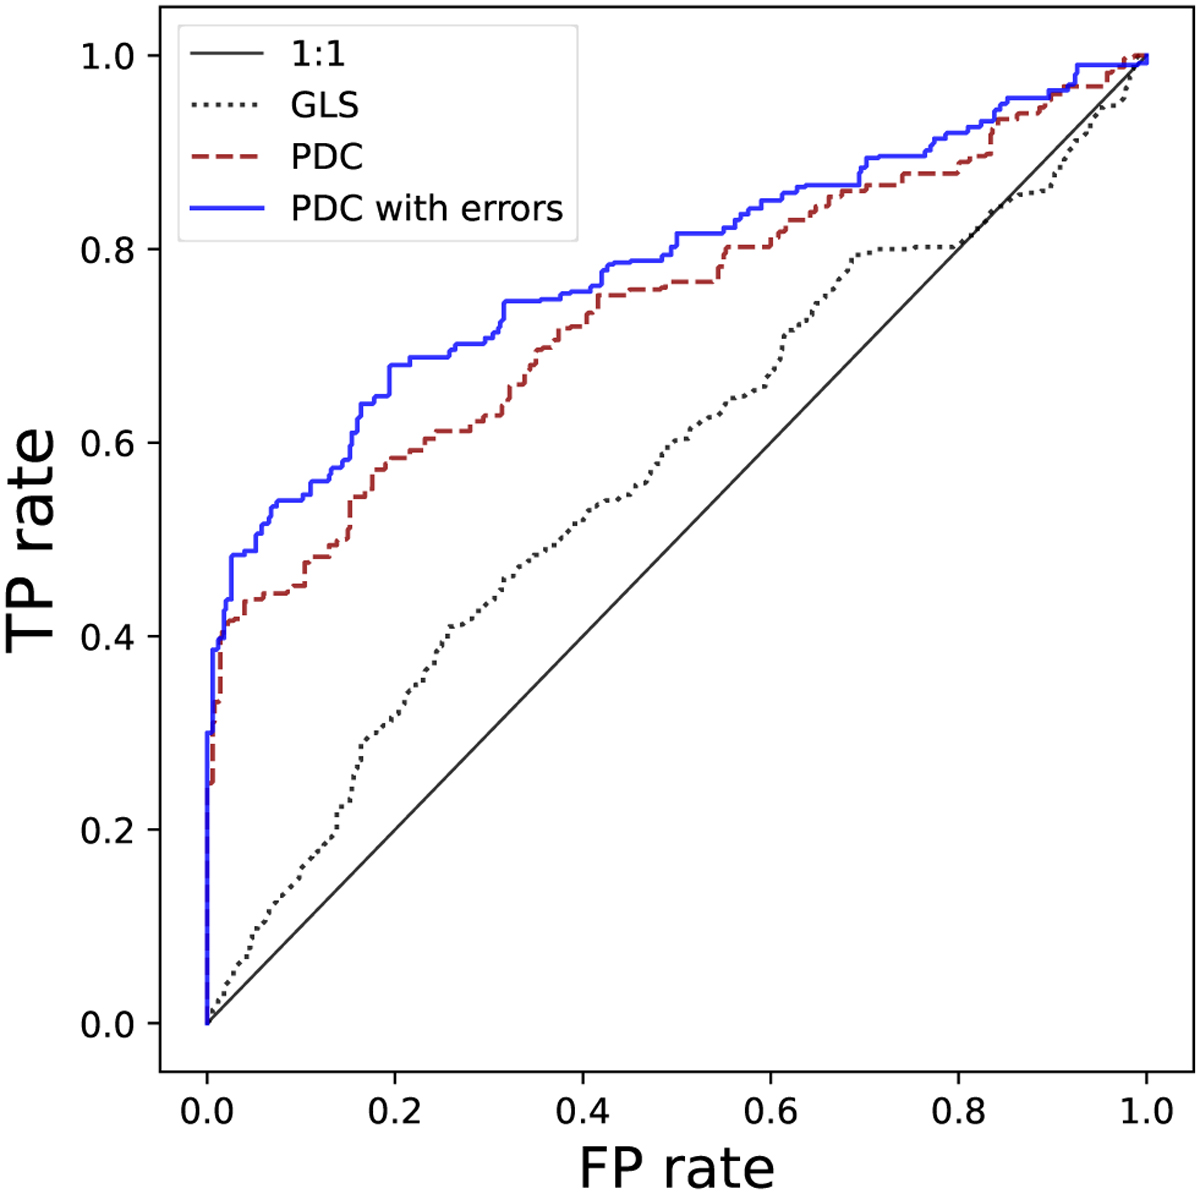
ROC curves for the case of eccentric Keplerian RV curves (e > 0.35). The dashed red line represents the regular PDC, and the solid blue line represents the new version presented in this paper. They both outperform the GLS periodogram, represented by the dotted grey line. The thin black line stands for a 1:1 random guess.
Current usage metrics show cumulative count of Article Views (full-text article views including HTML views, PDF and ePub downloads, according to the available data) and Abstracts Views on Vision4Press platform.
Data correspond to usage on the plateform after 2015. The current usage metrics is available 48-96 hours after online publication and is updated daily on week days.
Initial download of the metrics may take a while.