Fig. 9
Download original image
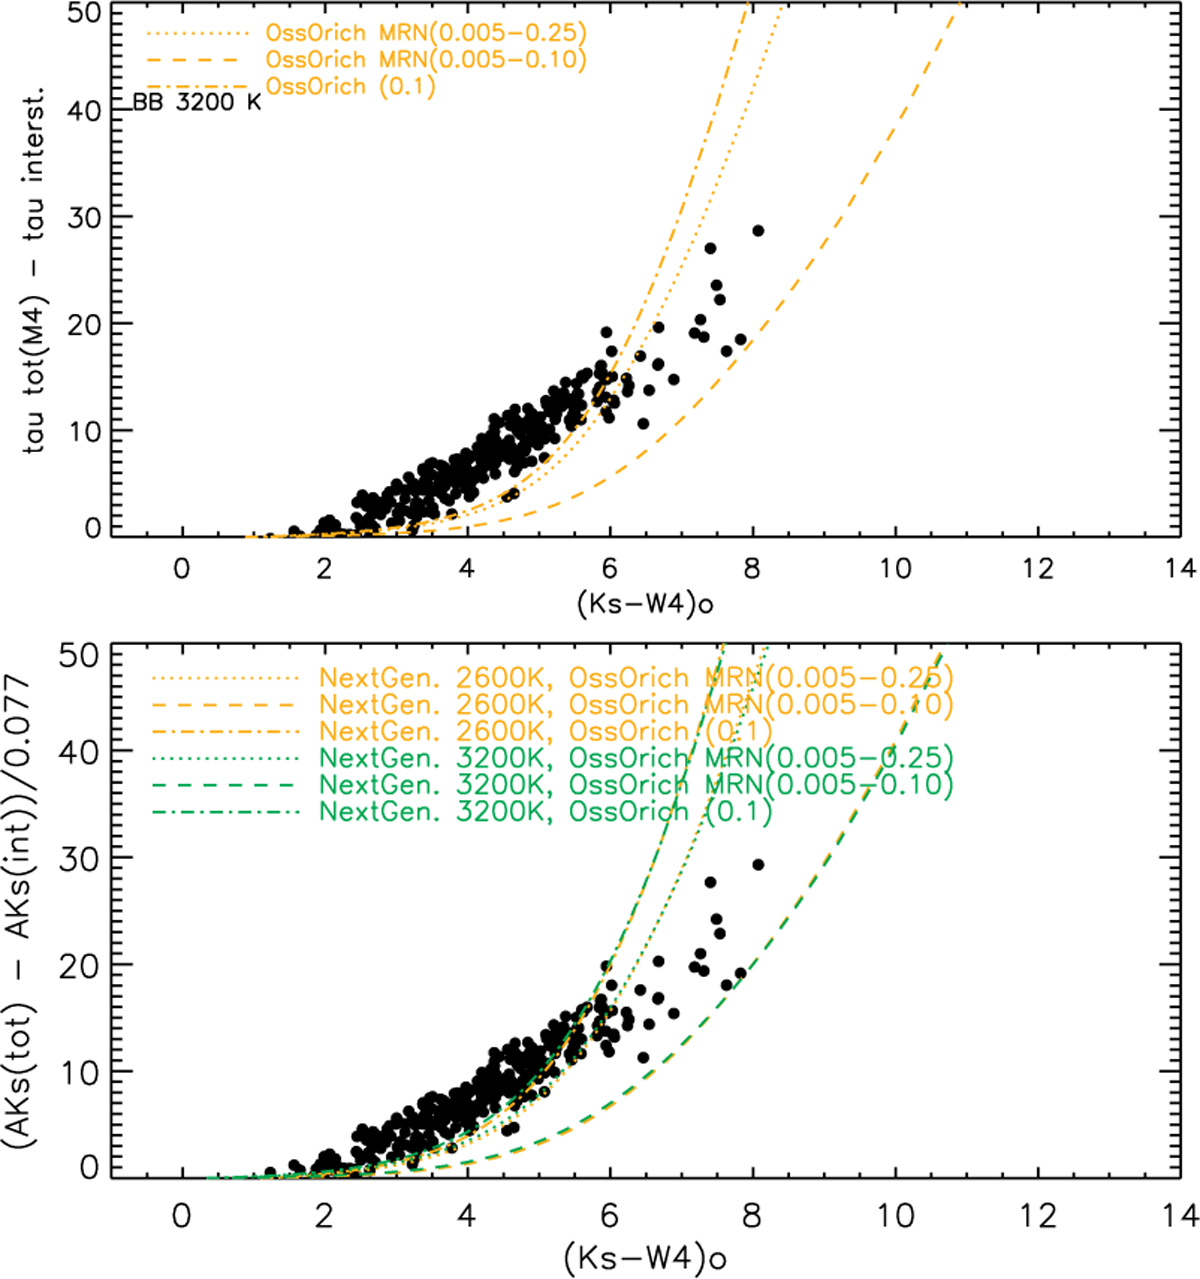
τ envelope (τ total minus τ interstellar) values of stars in Messineo et al. (2018) are plotted versus the dereddened (Ks−W4)o colours. Top panel: dusty models with a blackbody of 3200 K. Bottom panel shows dusty models of giant synthetic spectra with Teff of 2600 K (in orange) and 3200 K (in green), log = 1, and Z = 0 dex, from the NextGen library of Hauschildt et al. (1999). For every synthetic spectrum, three different curves obtained with DUSTY are over-plotted. The dashed-dotted model shows dust grains with a fixed size of 0.1 μm. The dotted model uses the MNR distribution with a minimum of 0.005 um and a maximum of 0.25 μm. The dashed model is based on the MNR distribution and has a maximum of 0.1 μm.
Current usage metrics show cumulative count of Article Views (full-text article views including HTML views, PDF and ePub downloads, according to the available data) and Abstracts Views on Vision4Press platform.
Data correspond to usage on the plateform after 2015. The current usage metrics is available 48-96 hours after online publication and is updated daily on week days.
Initial download of the metrics may take a while.