Fig. 3
Download original image
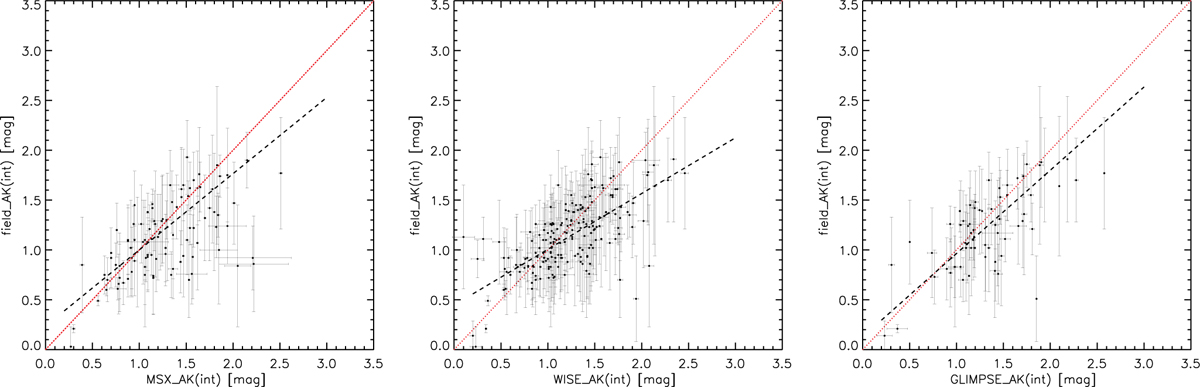
Comparison of the three ![]() (int) values estimated from three MIR datasets with the
(int) values estimated from three MIR datasets with the ![]() (int) values from surrounding stars. Left panel:
(int) values from surrounding stars. Left panel: ![]() (int) values from the MSX data are plotted vs. the median
(int) values from the MSX data are plotted vs. the median ![]() (int) estimated with surrounding stars by Messineo et al. (2005). Middle panel:
(int) estimated with surrounding stars by Messineo et al. (2005). Middle panel: ![]() (int) values from the WISE data are plotted vs. the median
(int) values from the WISE data are plotted vs. the median ![]() (int) from Messineo et al. (2005). Right panel:
(int) from Messineo et al. (2005). Right panel: ![]() (int) values from the GLIMPSE data are plotted versus the median
(int) values from the GLIMPSE data are plotted versus the median ![]() (int) from Messineo et al. (2005). The dashed lines are fits to the data points (see text); the red dotted lines are the equity lines.
(int) from Messineo et al. (2005). The dashed lines are fits to the data points (see text); the red dotted lines are the equity lines.
Current usage metrics show cumulative count of Article Views (full-text article views including HTML views, PDF and ePub downloads, according to the available data) and Abstracts Views on Vision4Press platform.
Data correspond to usage on the plateform after 2015. The current usage metrics is available 48-96 hours after online publication and is updated daily on week days.
Initial download of the metrics may take a while.