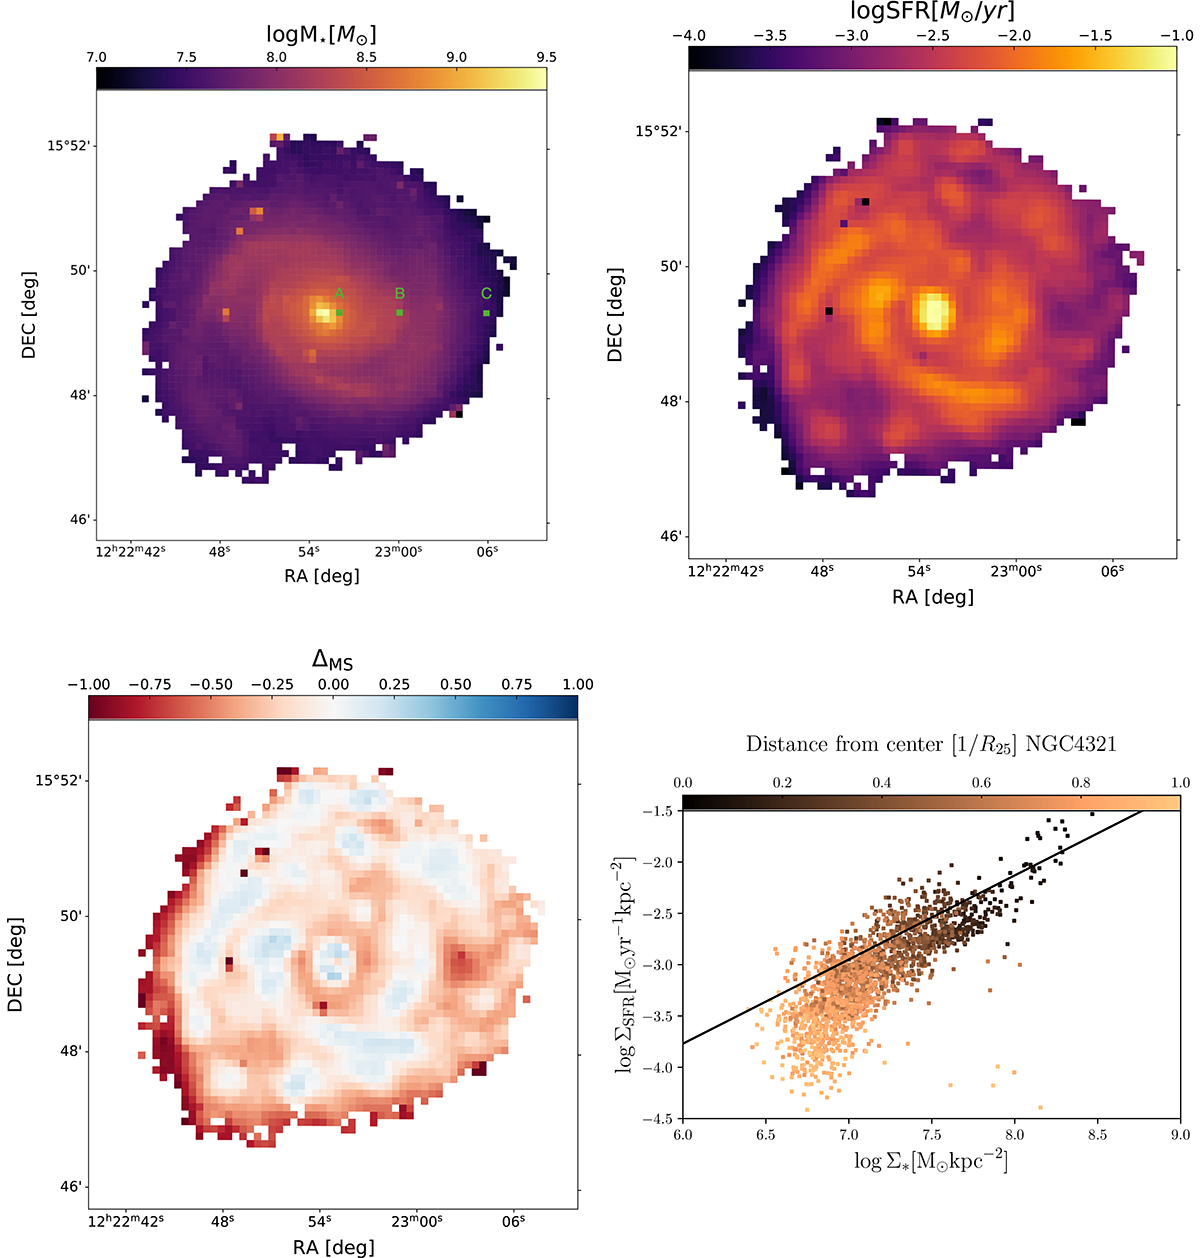
Fig. 1.
Download original image
Summary plot for NGC4321. The panels are organised as follows: stellar mass surface density (upper left), SFR surface density (upper right), distance from the MS (bottom left), and spatially resolved MS (bottom right). The solid black line shows the spatially resolved main sequence by Enia et al. (2020), and each point is colour-coded by the cell distance from the galaxy centre. In the first panel, three apertures (A, B, and C) are highlighted. The corresponding SED plot for each is reported in Appendix A.
Current usage metrics show cumulative count of Article Views (full-text article views including HTML views, PDF and ePub downloads, according to the available data) and Abstracts Views on Vision4Press platform.
Data correspond to usage on the plateform after 2015. The current usage metrics is available 48-96 hours after online publication and is updated daily on week days.
Initial download of the metrics may take a while.