Fig. 15
Download original image
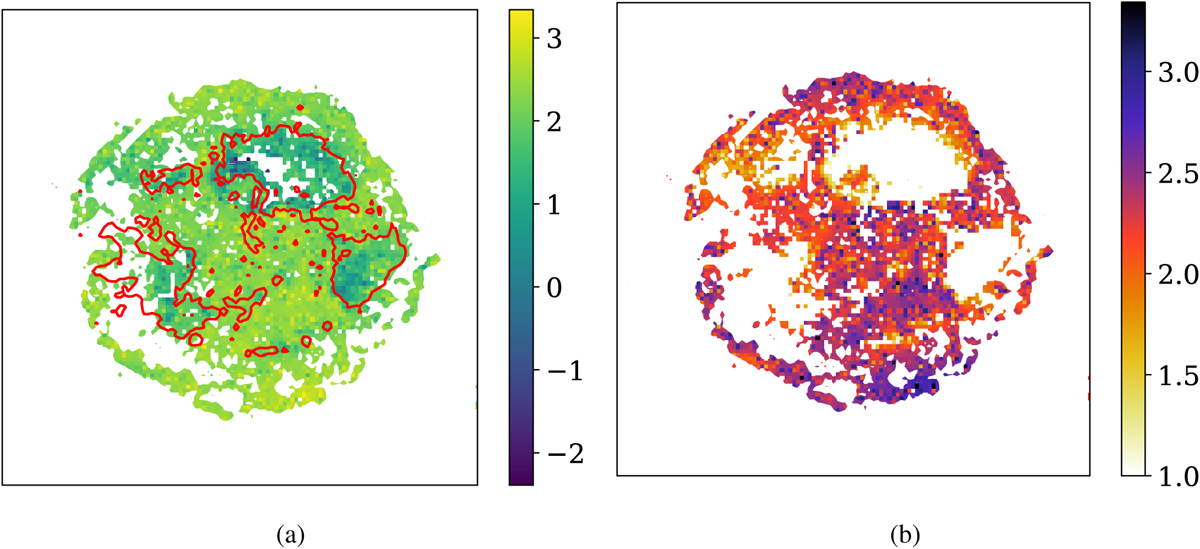
Reconstructed synchrotron photon index map. (a) Inside the red contours, the amplitude of the thermal component was over 103 per pixel. In this area, there was on average over twice as much of the thermal component (the ratio of the mean thermal amplitude over the mean synchrotron amplitude was 2.2). (b) Same photon index map as (a) but a minimum value of the index was fixed at one. We observed that though our algorithm has found some negative values for the photon index in some pixels, they are only in areas where the thermal component drowns out the synchrotron component completely and can thus be disregarded.
Current usage metrics show cumulative count of Article Views (full-text article views including HTML views, PDF and ePub downloads, according to the available data) and Abstracts Views on Vision4Press platform.
Data correspond to usage on the plateform after 2015. The current usage metrics is available 48-96 hours after online publication and is updated daily on week days.
Initial download of the metrics may take a while.