Fig. 6
Download original image
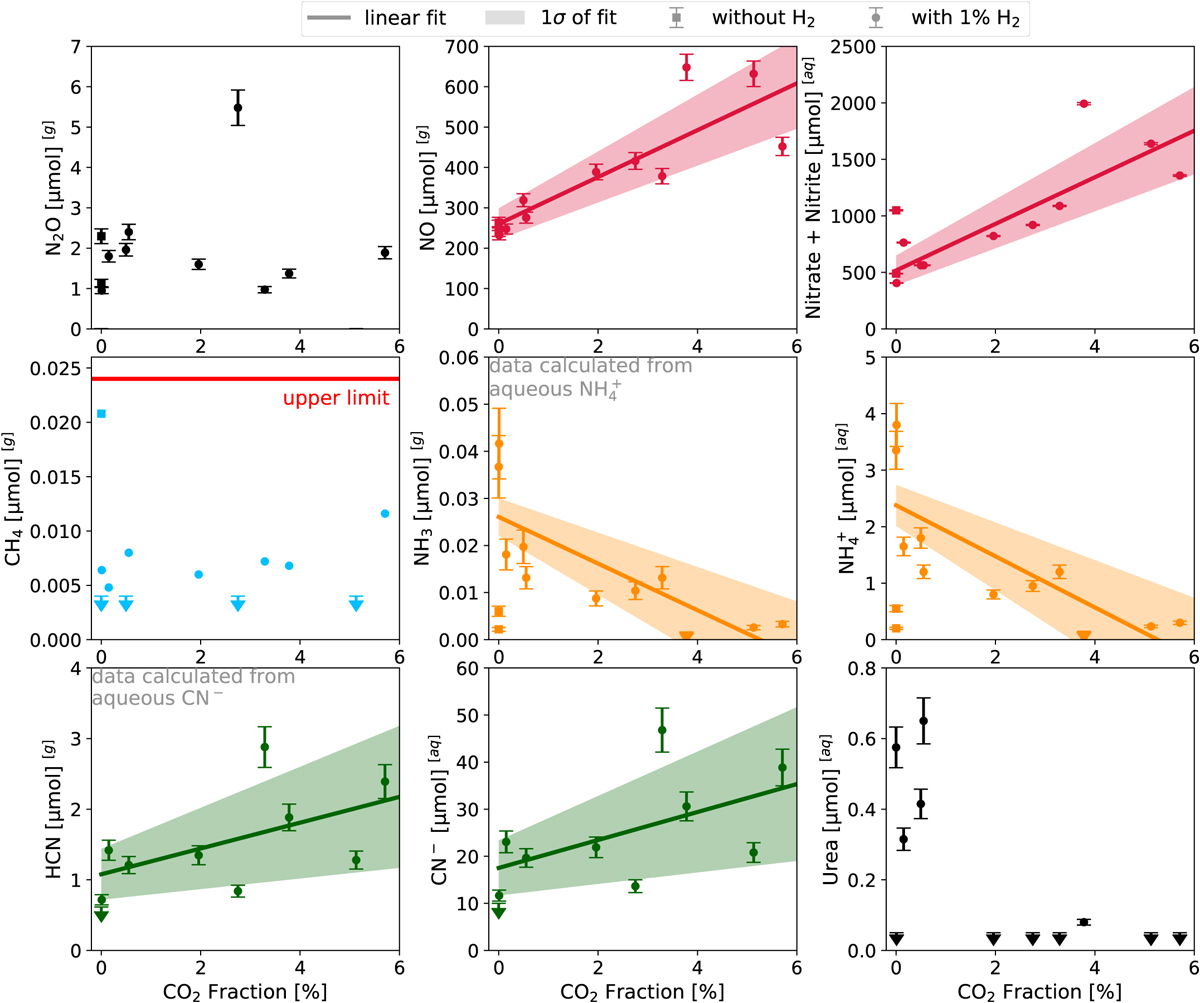
Final abundances of gaseous([g]; nitrous oxide (N2O), methane (CH4), hydrogen cyanide (HCN), nitric oxide (NO), and ammonia (NH3)) and aqueous products ([aq]; CN−, nitrite + nitrate, ![]() , and urea) in overnight experiments. Data points represent individual experiments with varying CO2 fractions. Experiments without any H2 and CO2 are indicated by squares and not included in fits. Lines are best linear fits for dependency between CO2 concentration and the final abundance of products. Measurements below the detection limit (arrows) are included as (Detection Limit /
, and urea) in overnight experiments. Data points represent individual experiments with varying CO2 fractions. Experiments without any H2 and CO2 are indicated by squares and not included in fits. Lines are best linear fits for dependency between CO2 concentration and the final abundance of products. Measurements below the detection limit (arrows) are included as (Detection Limit / ![]() ) in the fitting process. Shaded areas give 1σ-range. No fit is shown for methane since all measured values are within 1σ of 0 (red line), for nitrous oxide since there is no trend visible in the data, and for urea as most measurements for CO2 > 1% below the detection limit. Abundances of HCN and NH3 are calculated from measured aqueous abundances of CN− and
) in the fitting process. Shaded areas give 1σ-range. No fit is shown for methane since all measured values are within 1σ of 0 (red line), for nitrous oxide since there is no trend visible in the data, and for urea as most measurements for CO2 > 1% below the detection limit. Abundances of HCN and NH3 are calculated from measured aqueous abundances of CN− and ![]() , respectively.
, respectively.
Current usage metrics show cumulative count of Article Views (full-text article views including HTML views, PDF and ePub downloads, according to the available data) and Abstracts Views on Vision4Press platform.
Data correspond to usage on the plateform after 2015. The current usage metrics is available 48-96 hours after online publication and is updated daily on week days.
Initial download of the metrics may take a while.