Fig. 9.
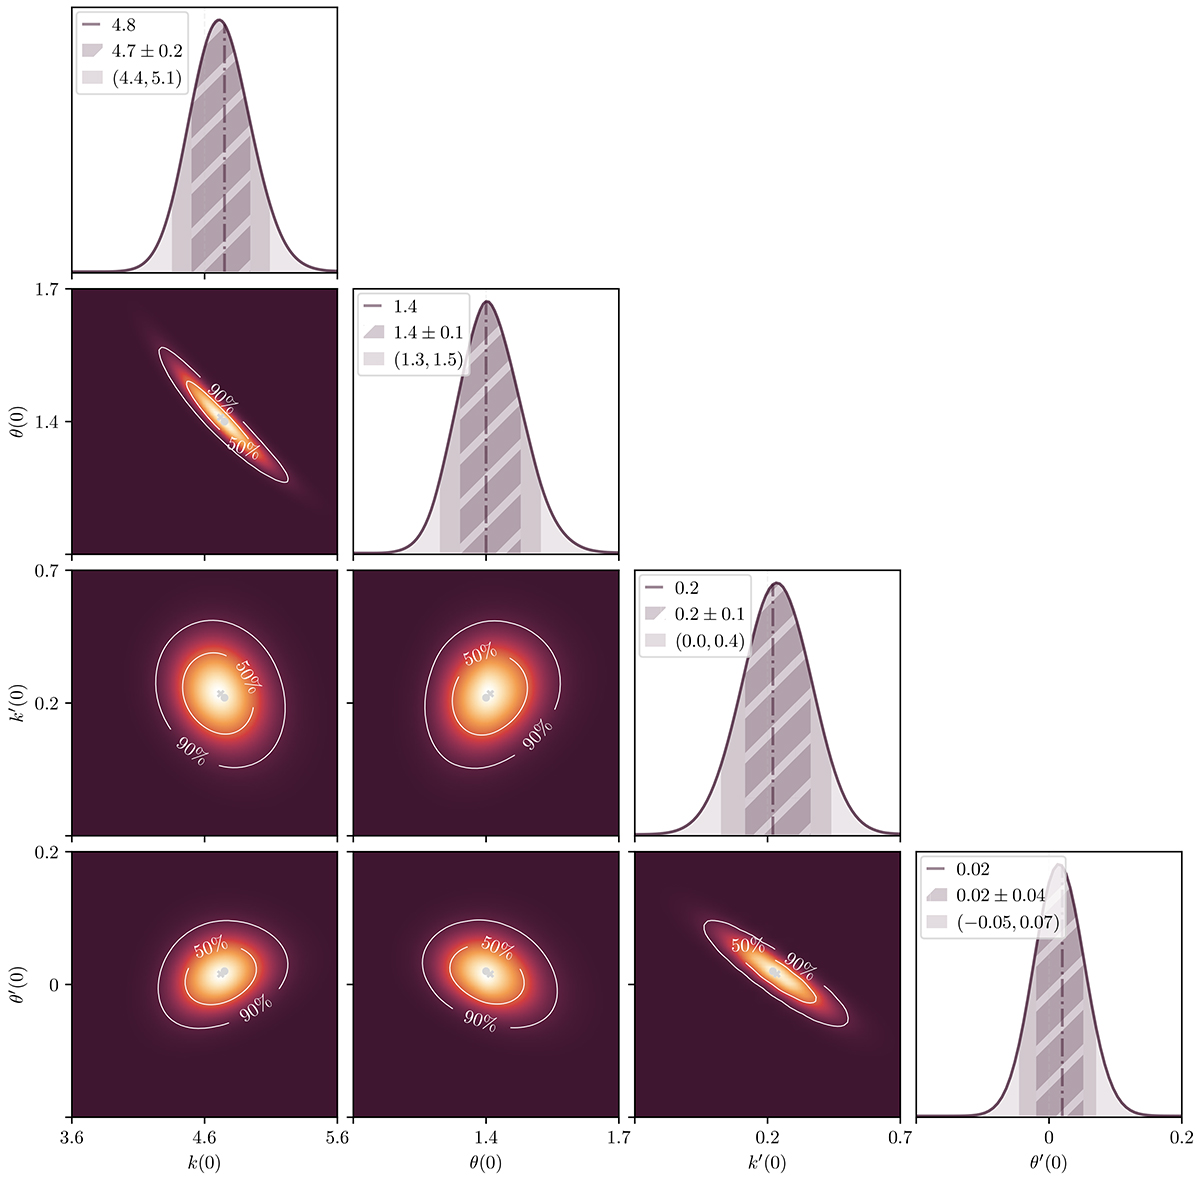
Download original image
Posterior distribution over k(0), θ(0), k′(0), and θ′(0), based on selected Local Universe LoTSS DR1 RGs. We show all two-parameter marginals of the likelihood function, with contours enclosing 50% and 90% of total probability. We mark the MLE (grey dot) and the maximum a posteriori (MAP; grey cross). The one-parameter marginals again show the MLE (dash-dotted line), a mean-centred interval of standard deviation–sized half-width (hashed region), and a median-centred 90% credible interval (shaded region). We used flexible voxel method densities. For fixed voxel method densities, see Fig. D.2.
Current usage metrics show cumulative count of Article Views (full-text article views including HTML views, PDF and ePub downloads, according to the available data) and Abstracts Views on Vision4Press platform.
Data correspond to usage on the plateform after 2015. The current usage metrics is available 48-96 hours after online publication and is updated daily on week days.
Initial download of the metrics may take a while.