Fig. 5.
Download original image
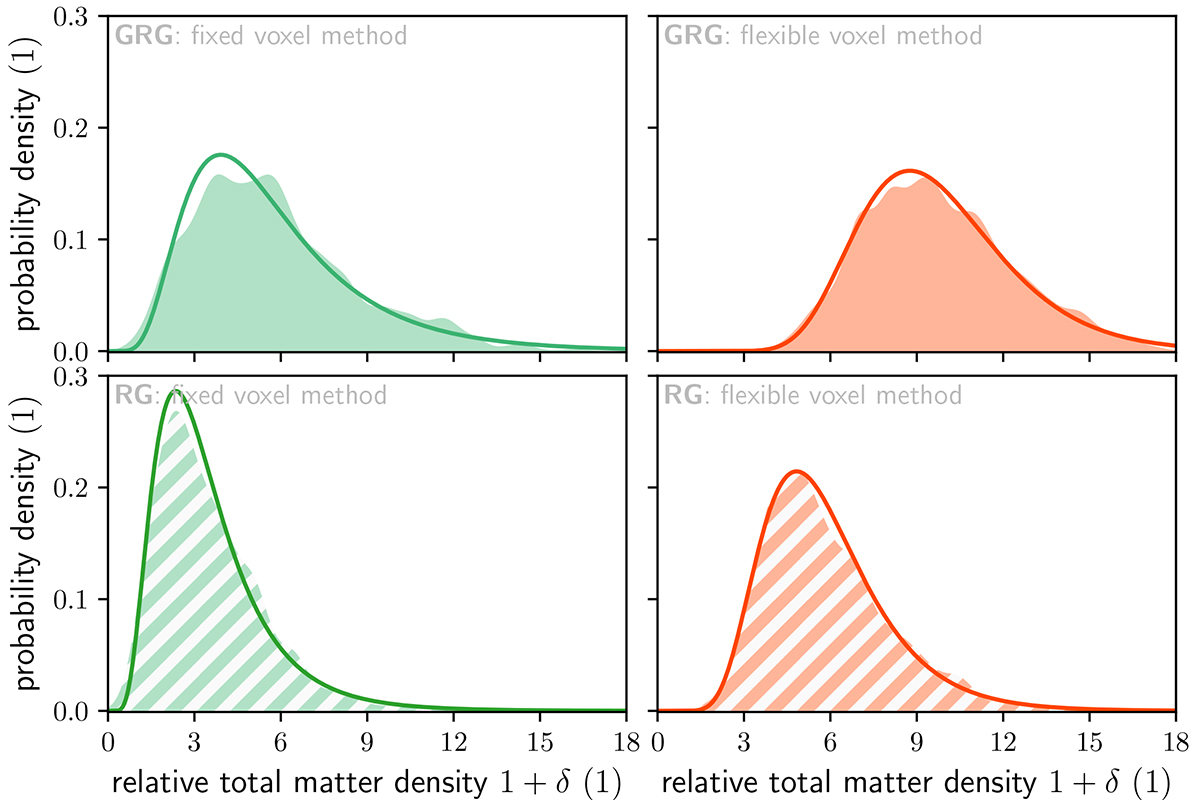
Distributions for the measured relative total matter density RVs 1 + ΔGRG, obs | 1 + ΔGRG = 1 + δ and 1 + ΔRG, obs | 1 + ΔRG = 1 + δ for an individual giant (top row; solid), and for an individual RG (bottom row; hatched). Fixed voxel method densities (left column; green) are lower than flexible voxel method densities (right column; orange). The MLE-fitted lognormal PDFs (solid curves) demonstrate that the distributions are almost lognormal.
Current usage metrics show cumulative count of Article Views (full-text article views including HTML views, PDF and ePub downloads, according to the available data) and Abstracts Views on Vision4Press platform.
Data correspond to usage on the plateform after 2015. The current usage metrics is available 48-96 hours after online publication and is updated daily on week days.
Initial download of the metrics may take a while.