Fig. 18.
Download original image
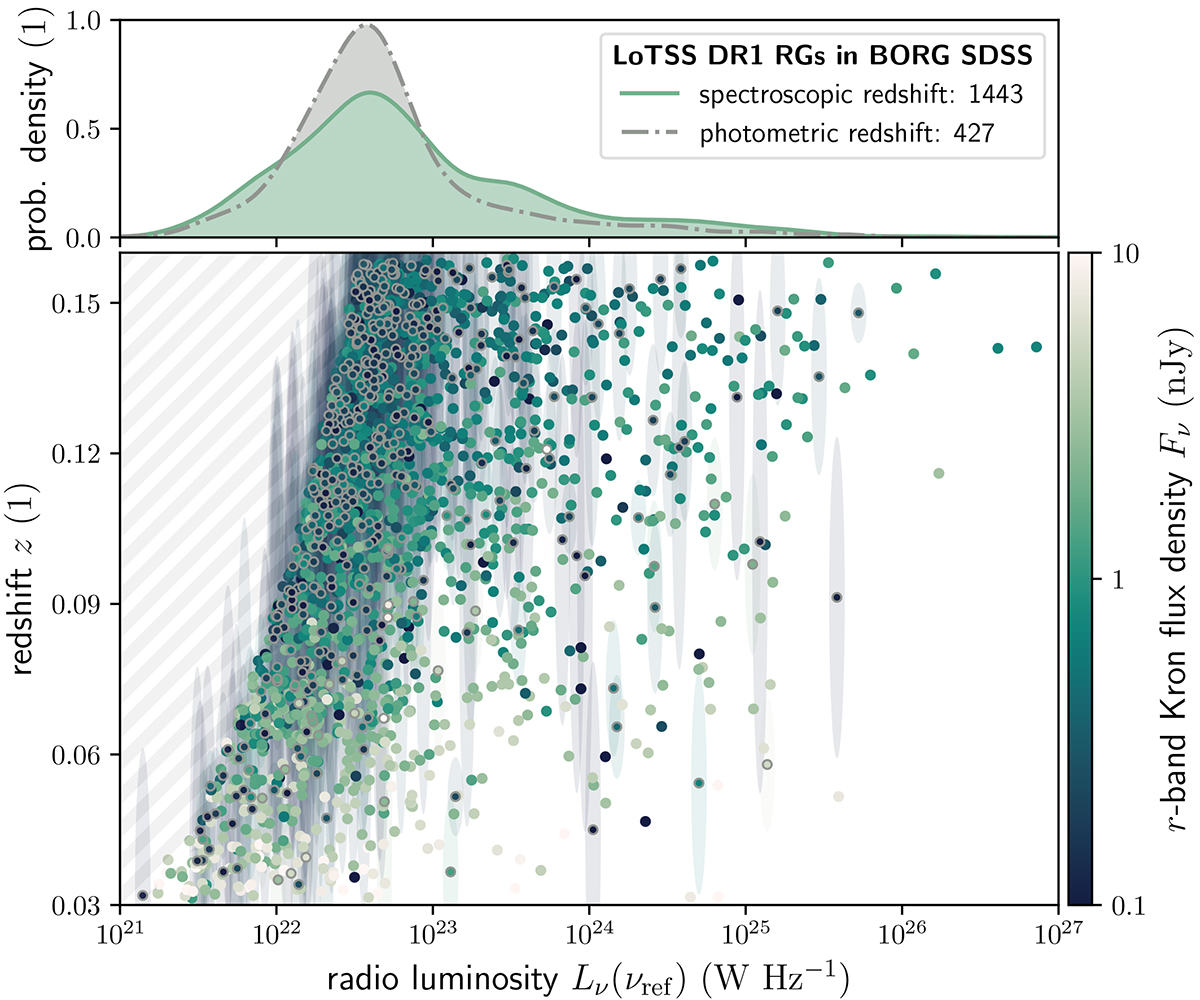
Overview of radio luminosity selection resulting from spectroscopic redshift selection, radio surface brightness limitations, and the correlation between radio and optical luminosity. The top panel compares radio luminosity distributions at νref = 150 MHz of LoTSS DR1 RGs in the constrained part of the BORG SDSS, distinguishing between those with spectroscopic redshifts (green) and those without (grey) (We perform KDE on samples of log10(Lν(νref)⋅(W Hz−1)−1) rather than of Lν(νref), and thus the probability densities on the vertical axis are dimensionless.). Radio galaxies with spectroscopic redshifts dominate (77%) the population. The bottom panel shows the two subpopulations in radio luminosity–redshift space, with RGs without spectroscopic redshifts marked (grey circles). We show uncertainty ellipses whose semi-major and semi-minor axes represent half a standard deviation along each dimension. One retrieves the top panel by collapsing the data on the horizontal axis.
Current usage metrics show cumulative count of Article Views (full-text article views including HTML views, PDF and ePub downloads, according to the available data) and Abstracts Views on Vision4Press platform.
Data correspond to usage on the plateform after 2015. The current usage metrics is available 48-96 hours after online publication and is updated daily on week days.
Initial download of the metrics may take a while.