Fig. 10.
Download original image
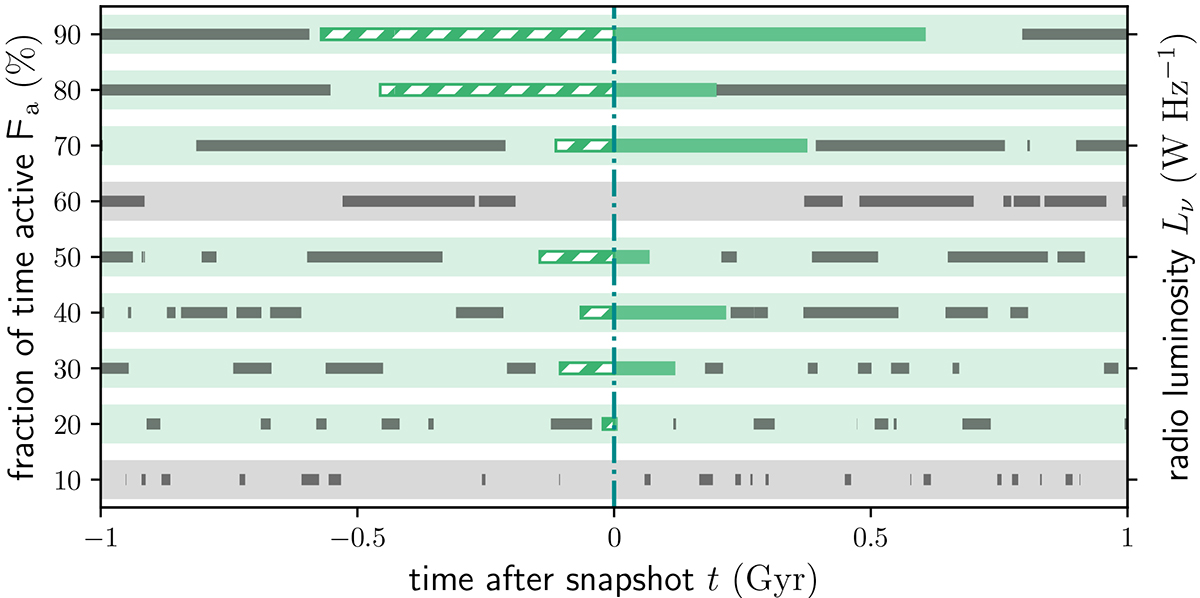
Monte Carlo simulation of a population of nine galaxies (thick stripes) with successive active and quiescent phases. We mark the active phases (thin stripes). Each galaxy spends a different fraction ϝa of the time in the active phase. We model the time spent in both phases as draws from exponential distributions: ta ∼ Exp(λa) and tq ∼ Exp(λq). We assume that all galaxies share the same quiescent phase rate parameter λq = 10 Gyr−1, although this may not be entirely correct (Turner & Shabala 2015). This assumption fixes the active phase rate parameter: ![]() . On human time scales, we can access only a snapshot view of this population. During the present snapshot (vertical line), seven galaxies generate RGs, and could be included in an RG sample. RG ages at the snapshot (hatched parts of the thin green stripes) generally increase with ϝa.
. On human time scales, we can access only a snapshot view of this population. During the present snapshot (vertical line), seven galaxies generate RGs, and could be included in an RG sample. RG ages at the snapshot (hatched parts of the thin green stripes) generally increase with ϝa.
Current usage metrics show cumulative count of Article Views (full-text article views including HTML views, PDF and ePub downloads, according to the available data) and Abstracts Views on Vision4Press platform.
Data correspond to usage on the plateform after 2015. The current usage metrics is available 48-96 hours after online publication and is updated daily on week days.
Initial download of the metrics may take a while.