Fig. 9.
Download original image
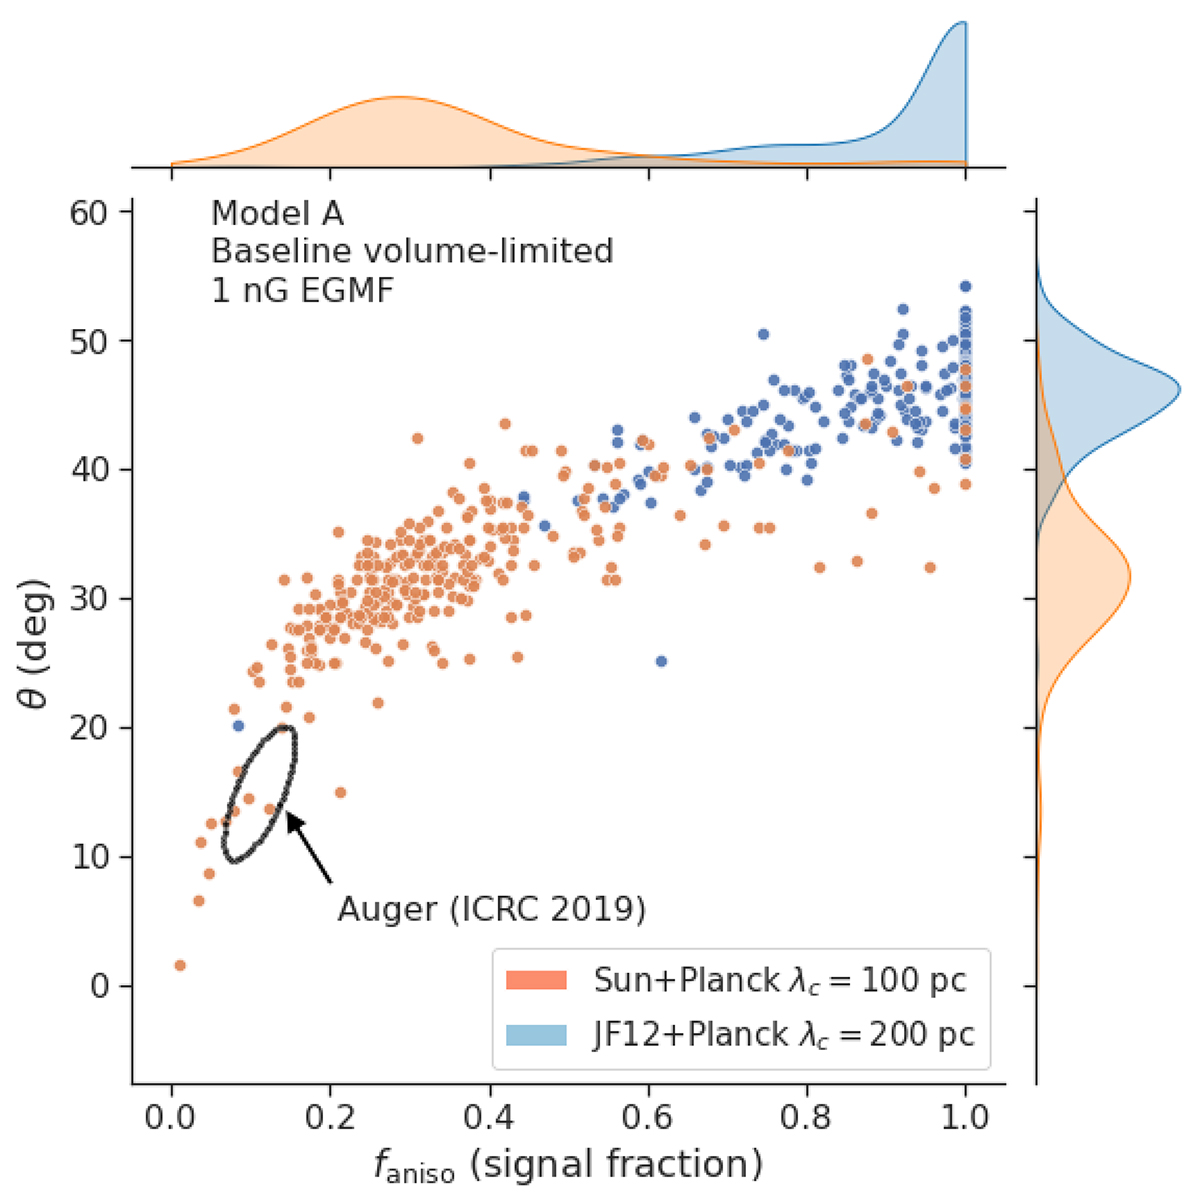
Best-fit parameters obtained after performing the likelihood analysis for the SBG catalogue on our datasets. The value of faniso and θ allowing to maximize the likelihood for each dataset are plotted against each other for the astrophysical model considered in Fig. 8 and two GMF models (see legend). The 1σ ellipse reported in Caccianiga et al. (2019) from Auger data is shown. The individual distributions of the different quantities plotted are shown on top of the coordinate axis.
Current usage metrics show cumulative count of Article Views (full-text article views including HTML views, PDF and ePub downloads, according to the available data) and Abstracts Views on Vision4Press platform.
Data correspond to usage on the plateform after 2015. The current usage metrics is available 48-96 hours after online publication and is updated daily on week days.
Initial download of the metrics may take a while.