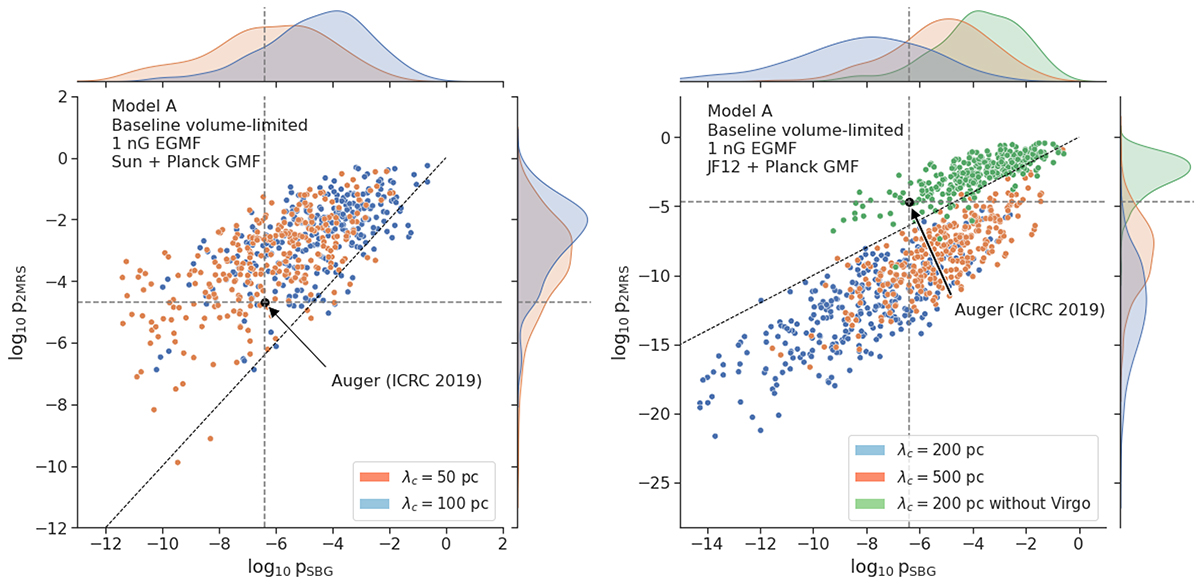
Fig. 8.
Download original image
p-values obtained after performing the likelihood analysis on our datasets. The logarithm of the p-value corresponding to the maximum likelihood obtained for the SBG catalogue (PSBG) catalogue is plotted against that obtained for 2MRS (P2MRS) for each dataset. The astrophysical model considered to build our datasets corresponds to model A, the baseline catalogue and a 1 nG EGMF. The values reported by Auger in Caccianiga et al. (2019) are shown with large black full circle. The individual distributions of the different quantities plotted are shown on top of the coordinate axis. The left panel shows the case of the Sun+Planck GMF model for two different values of the coherence length. The right panel shows the case of the JF12+Planck model. In this case we also show datasets produced after excluding galaxies from the Virgo association from the source catalogue (see legend).
Current usage metrics show cumulative count of Article Views (full-text article views including HTML views, PDF and ePub downloads, according to the available data) and Abstracts Views on Vision4Press platform.
Data correspond to usage on the plateform after 2015. The current usage metrics is available 48-96 hours after online publication and is updated daily on week days.
Initial download of the metrics may take a while.