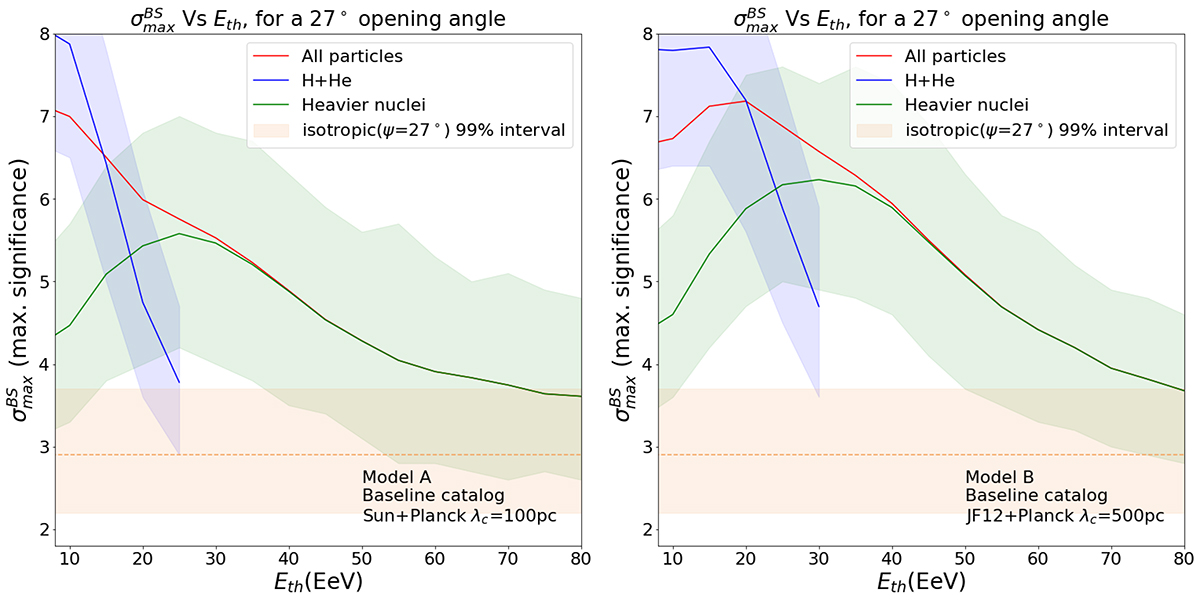
Fig. 7.
Download original image
Averaged Eth evolution of the BS maximum significance for different source composition models. The Eth evolution averaged over 300 datasets (setting ψ to 27°) is shown with a thick red line for the all particles dataset while the light (H+He) and heavier components are shown respectively in blue and green (the shaded areas show the 90% dispersion of the 300 datasets). The brown shaded area shows the 99% dispersion of isotropic datasets. For both panel, the baseline volume-limited catalogue and a 1 nG EGMF are assumed. The left panel shows the case of the source composition model A and the Sun+Planck GMF model with λc = 100 pc, and the right panel the case of model B and JF12+Planck model with λc = 500 pc.
Current usage metrics show cumulative count of Article Views (full-text article views including HTML views, PDF and ePub downloads, according to the available data) and Abstracts Views on Vision4Press platform.
Data correspond to usage on the plateform after 2015. The current usage metrics is available 48-96 hours after online publication and is updated daily on week days.
Initial download of the metrics may take a while.