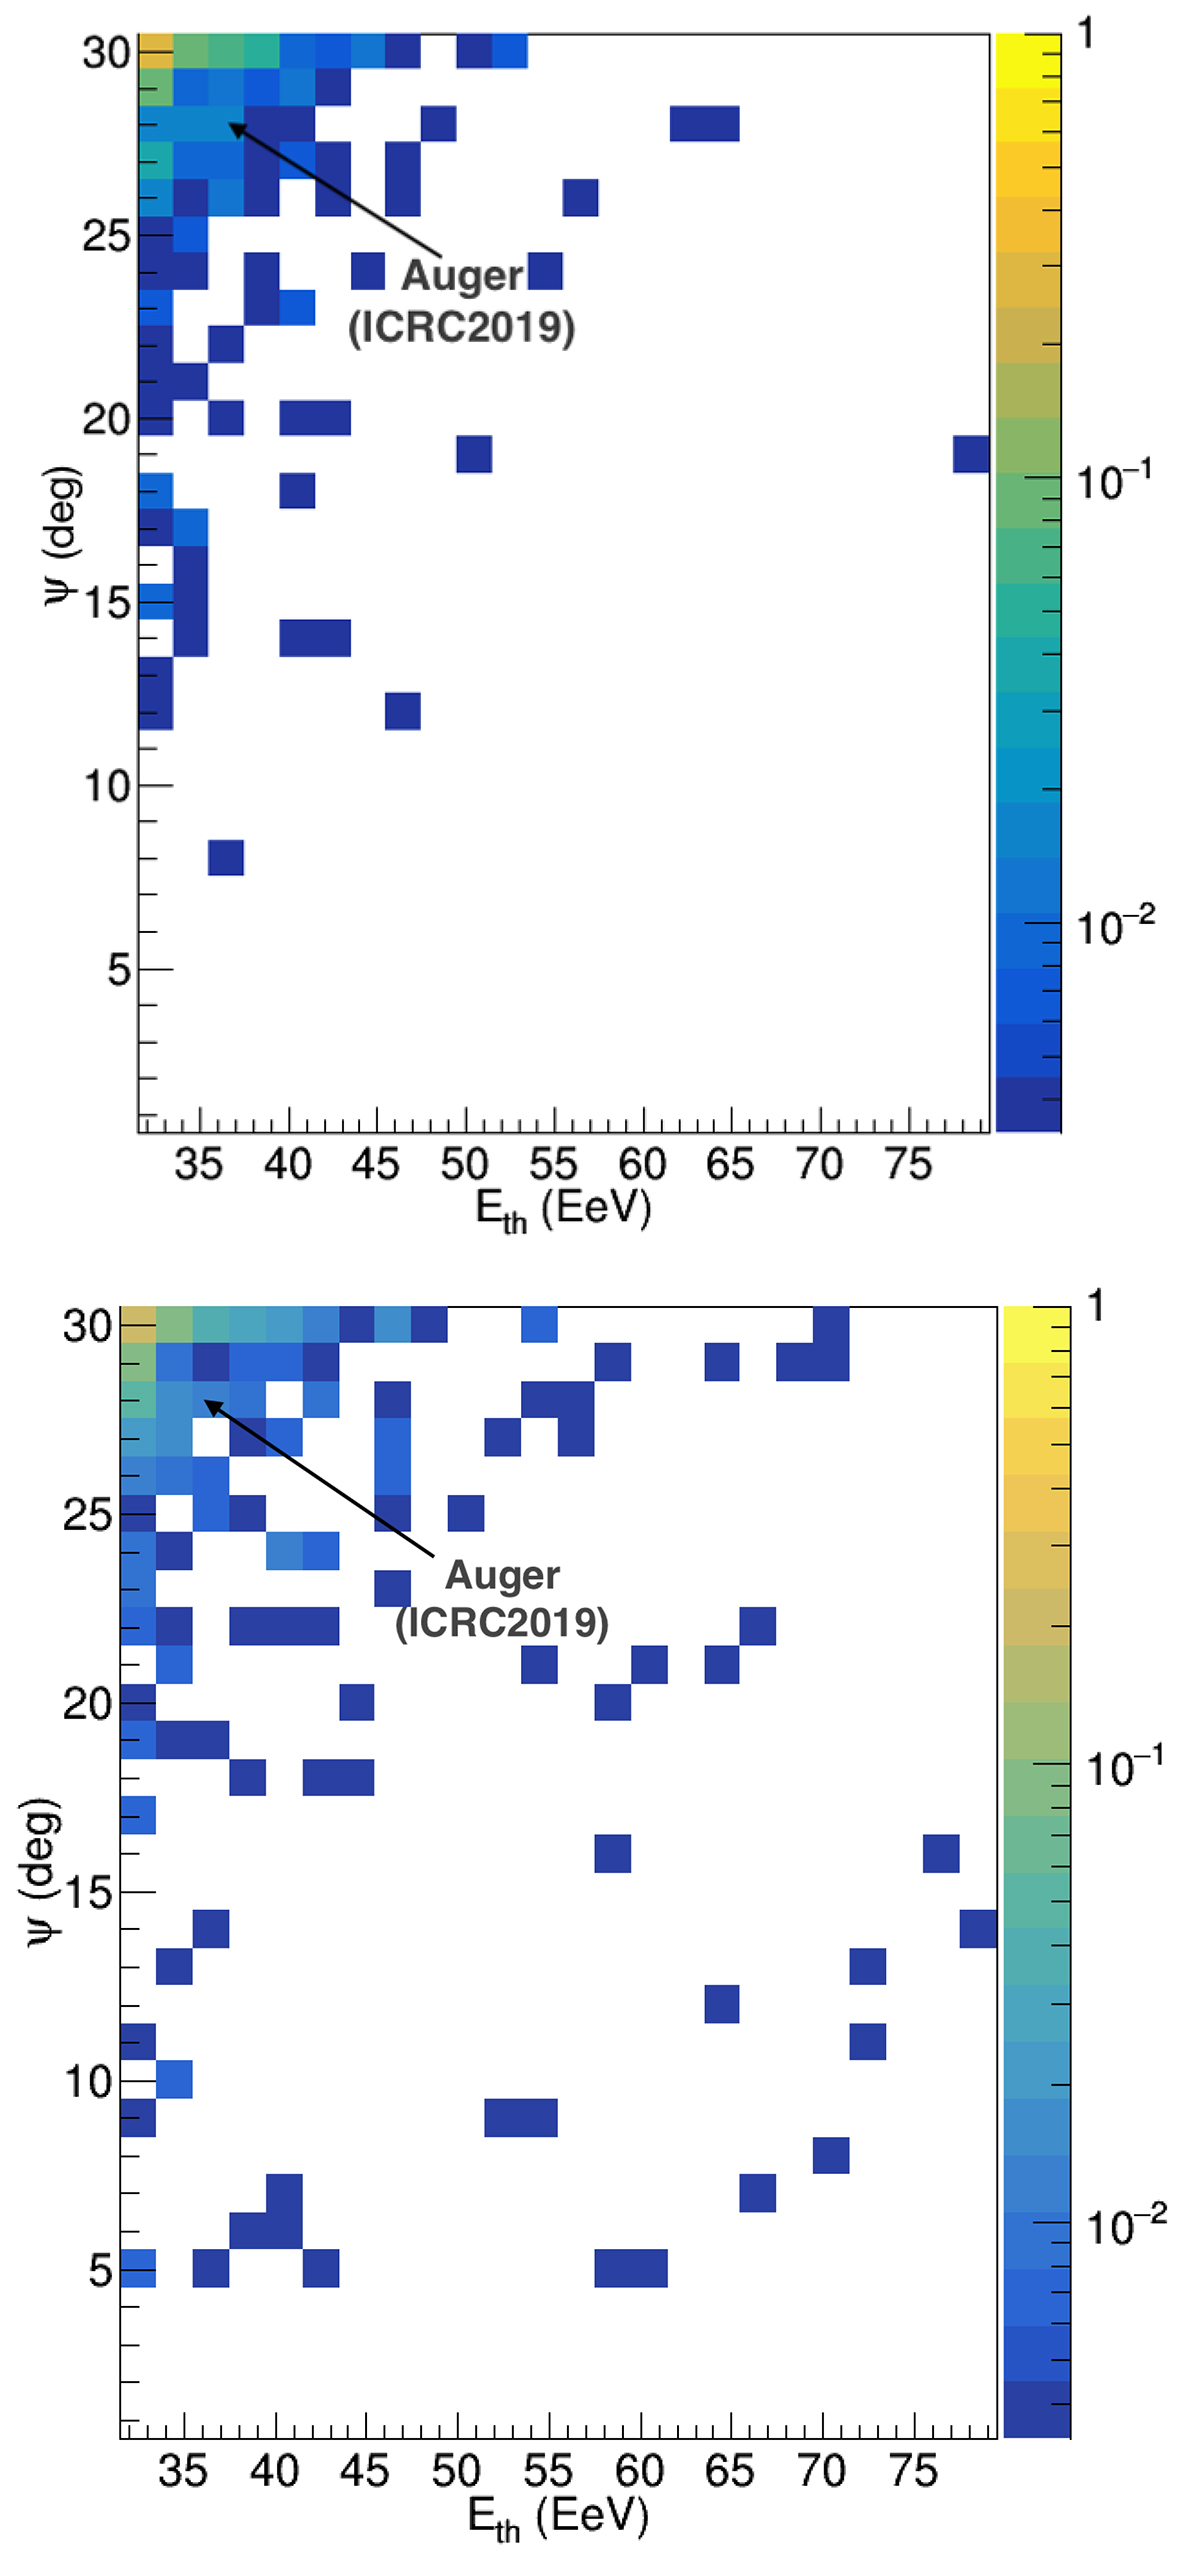
Fig. 4.
Download original image
Distribution of the threshold energy Eth and angular scale ψ of the BS maxima obtained after the analysis of 300 datasets assuming the same astrophysical models as in Fig. 2, the JF12+Planck model with λc = 200 pc (top panel), and the Sun+Planck model with λc = 100 pc (bottom panel). The colour scale represents the fraction of realisations for which the BS maximum is obtained in a given (Eth, ψ) bin.
Current usage metrics show cumulative count of Article Views (full-text article views including HTML views, PDF and ePub downloads, according to the available data) and Abstracts Views on Vision4Press platform.
Data correspond to usage on the plateform after 2015. The current usage metrics is available 48-96 hours after online publication and is updated daily on week days.
Initial download of the metrics may take a while.