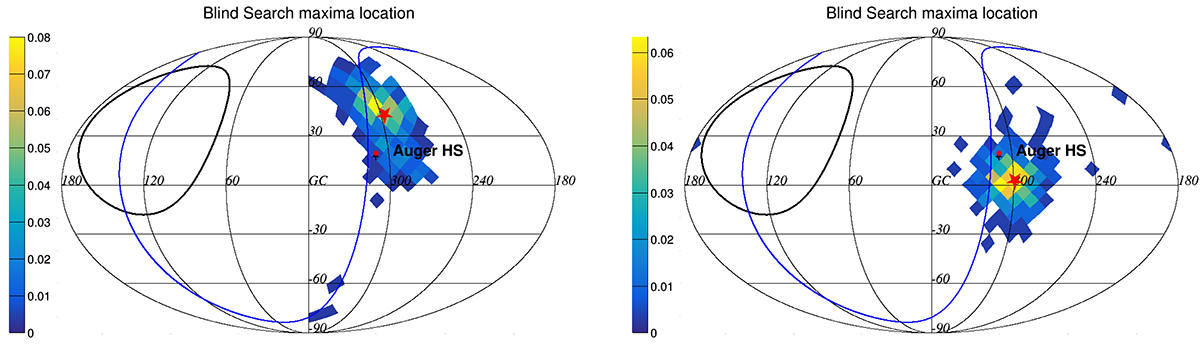
Fig. 2.
Download original image
Distribution of the locations of the BS maxima for the 300 datasets. The case of the JF+Planck model with λc = 200 pc (left) and the Sun+Planck model with λc = 100 pc (right) are shown. The colour scale represents the fraction of realisations for which the BS maximum is found in a given pixel of the sky (the pixel size correspond to Nside = 8 on these plots). The position of the CenA radio galaxy as well as the BS maximum location reported by Auger at the ICRC 2019 are shown with a red full circle and black star respectively (the two markers are practically on top of each other). The large red star shows the direction of the asymptotic BS maximum obtained with a 300 times larger simulated dataset (see text).
Current usage metrics show cumulative count of Article Views (full-text article views including HTML views, PDF and ePub downloads, according to the available data) and Abstracts Views on Vision4Press platform.
Data correspond to usage on the plateform after 2015. The current usage metrics is available 48-96 hours after online publication and is updated daily on week days.
Initial download of the metrics may take a while.