Fig. 19.
Download original image
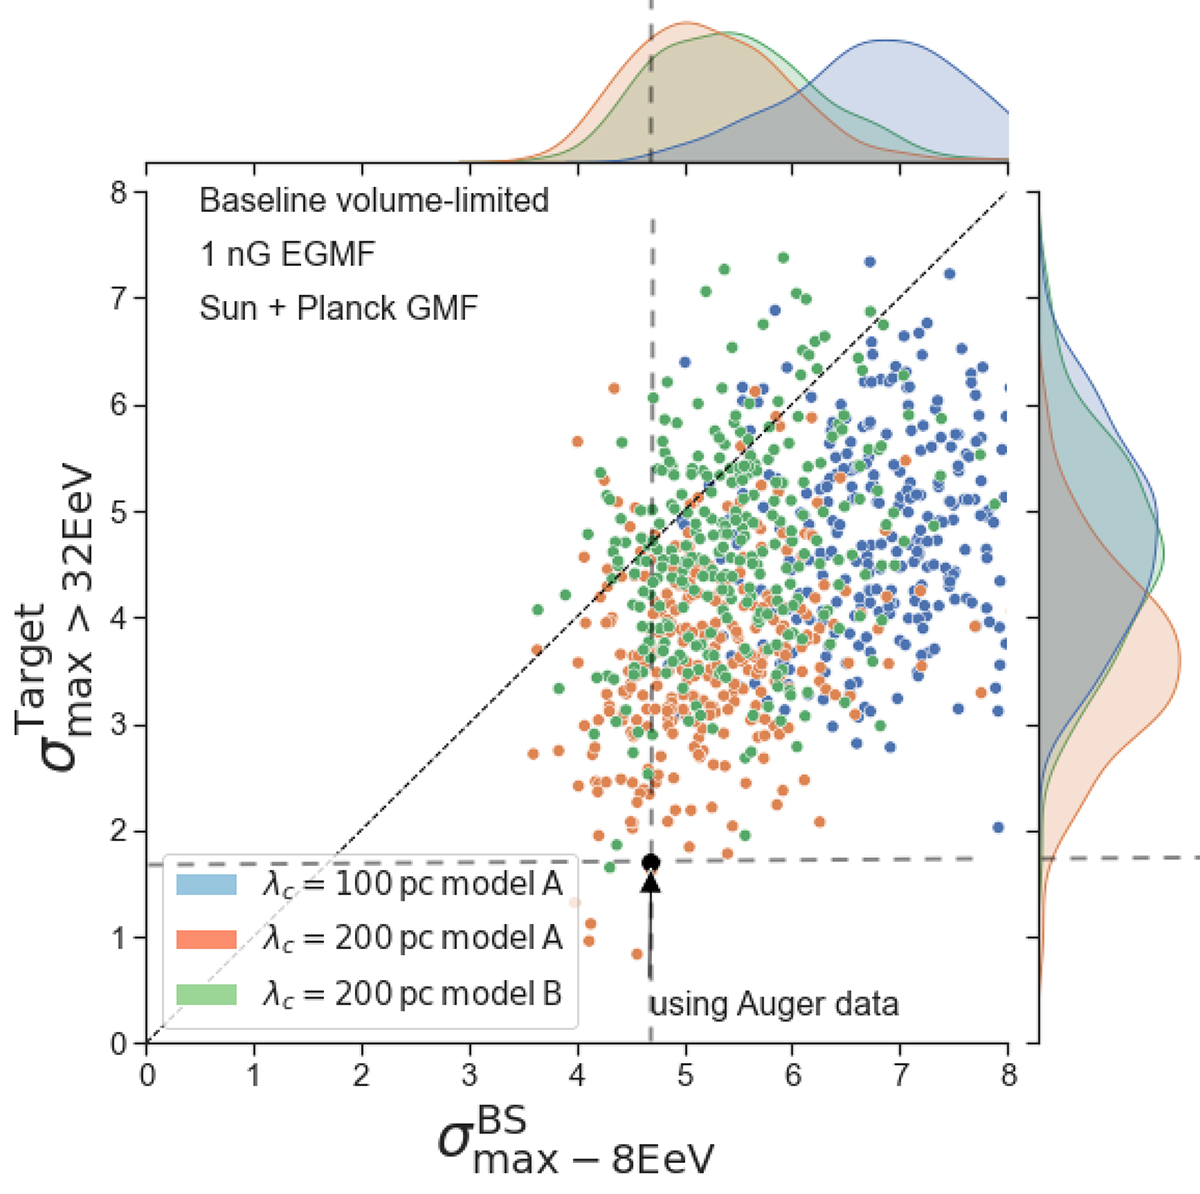
Scatter plot of the maximum significances for Eth > 32 EeV of the flux excess in the direction of the BS maximum at 8 EeV, ![]() vs. the corresponding value of
vs. the corresponding value of ![]() (see text). The different colours correspond to different underlying astrophysical scenarios, as indicated on the plot. The two values of σmax obtained with the Auger data are indicated by the black dot.
(see text). The different colours correspond to different underlying astrophysical scenarios, as indicated on the plot. The two values of σmax obtained with the Auger data are indicated by the black dot.
Current usage metrics show cumulative count of Article Views (full-text article views including HTML views, PDF and ePub downloads, according to the available data) and Abstracts Views on Vision4Press platform.
Data correspond to usage on the plateform after 2015. The current usage metrics is available 48-96 hours after online publication and is updated daily on week days.
Initial download of the metrics may take a while.