Fig. 10.
Download original image
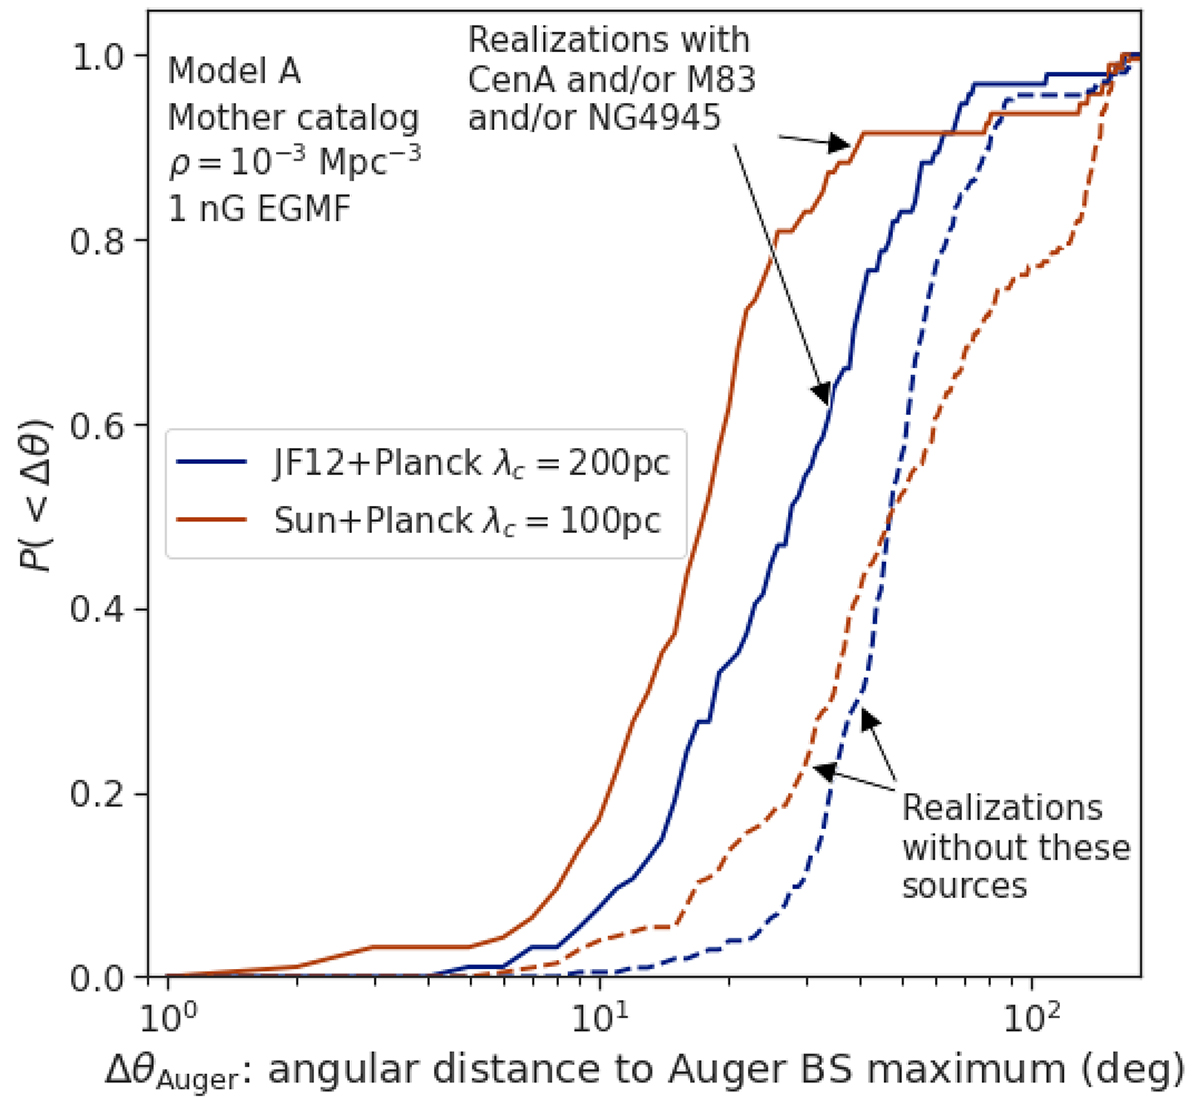
Cumulative distributions of the angular distance ΔθAuger (see Sect. 4.2), obtained for the mother catalogue approach with model A, a source density of 10−3 Mpc−3 and a 1 nG EGMF. The red and blue curves correspond to different GMF models, as indicated. Separate distributions are shown for source realisations including either Cen A, NGC4945 or M83 (solid lines) and source realisations including none of those (dashed lines).
Current usage metrics show cumulative count of Article Views (full-text article views including HTML views, PDF and ePub downloads, according to the available data) and Abstracts Views on Vision4Press platform.
Data correspond to usage on the plateform after 2015. The current usage metrics is available 48-96 hours after online publication and is updated daily on week days.
Initial download of the metrics may take a while.