Fig. 1.
Download original image
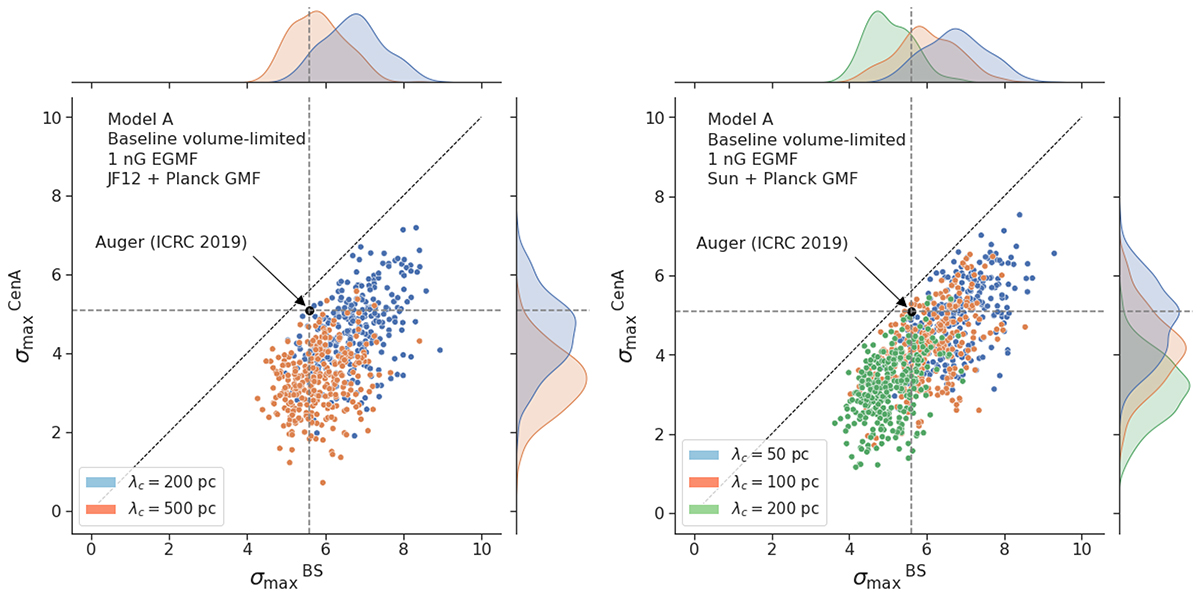
Result of the BS and CenA flux excess analyses for our baseline volume-limited scenario, after scanning over the same parameter space in Eth and ψ as Auger (see text). Scatter plot of the CenA flux excess maximum significance versus the BS maximum significance obtained for 300 datasets using the JF+Planck (left) and the Sun+Planck (right) GMF models. Various coherence lenghts λc are considered for the GMF turbulent component (see legends). The values reported for Auger dataset at the ICRC 2019 are shown with a large black circle, the distributions of ![]() and
and ![]() are also shown separately on top of the coordinate axis.
are also shown separately on top of the coordinate axis.
Current usage metrics show cumulative count of Article Views (full-text article views including HTML views, PDF and ePub downloads, according to the available data) and Abstracts Views on Vision4Press platform.
Data correspond to usage on the plateform after 2015. The current usage metrics is available 48-96 hours after online publication and is updated daily on week days.
Initial download of the metrics may take a while.